Introducing Datalayers
A datalayer is a logical temporary container for data retrieved from a datasource and cached as XML data on the web server. This topic introduces developers to the use of datalayers within Logi reporting products.
- Selecting the Correct Datalayer
- Using the Data
- Data Scope and Local Data
- Manipulating the Datalayer
- Datalayer Error Handling
- Usage Examples
Selecting the Correct Datalayer
In Logi reporting products, developers use datalayers to retrieve data for tables, charts, and input select lists from a datasource. A datasource can be one of the following:
- OLEDB-, ODBC-, or JDBC-compliant databases
- XML, CSV, Excel, or other files
- LDAP directories
- Web Feeds, Web Services, or web pages
- Hard-coded, static data
- Your Logi application's metadata
A number of different datalayer elements are available and your selection can depend on both the datasource and the retrieval technique. In addition, some datalayers are not available in Logi Report; check individual element documentation for availability.
The following table lists the typical uses for datalayers within Logi reporting products. The links direct you to individual documents that discuss the use of each datalayer.
| Datalayer Type | Description |
|---|---|
| DataLayer.ActiveSQL | A special type of datalayer designed for use with the Analysis Grid super-element, it only retrieves a limited number of rows based on an initial SQL query and, in response to runtime manipulations of the Analysis Grid interface by users, it dynamically modifies and resends its query. Introduced in v11. |
| DataLayer.Bookmarks | Retrieves data directly from bookmark collection files. |
| DataLayer.Cached | Modifies the normal data retrieval activities of datalayers; when it's used, data is retrieved, cached, and made available for use in Logi reports for a specific time period, after which the data is refreshed (deleted and recreated). |
| DataLayer.CSV | Retrieves data directly from a .CSV text file. |
| DataLayer.Definition List | Retrieves a list of definition files used in your application, and their properties, such as author name, timestamp, and engine version. |
| DataLayer.Directory | Retrieves a list of files and/or folders in a specified directory, including their size, timestamps, and other properties. |
| DataLayer.Excel | Retrieves data directly from a Microsoft Excel spreadsheet file. |
| DataLayer.Fixed File Format | Retrieves data directly from text files that use column widths to specify data format. |
| DataLayer.Google App | Enables connection to the datastore of a published application hosted by the Google App Engine. |
| Introducing Datalayers | Retrieves data in a Google online spreadsheet. |
| DataLayer.GPX File | Retrieves data directly from a GIS data file in the GPX format. |
| DataLayer.KML File | Retrieves data directly from a GIS data file in the KML format. |
| DataLayer.LDAP | Retrieves data from a Lightweight Directory Access Protocol (LDAP) directory. |
| DataLayer.LDAP-Auth | Authenticates user against a Lightweight Directory Access Protocol (LDAP) directory. |
| Link Datalayers | Reuses data retrieved in another datalayer. |
| DataLayer.MDX | Retrieves cube data and populates Logi OLAP Grid or OLAP Table elements. |
| DataLayer.MongoDB | Retrieves data from a MongoDB document collection. |
| DataLayer.Mongo Find | Retrieves documents from a MongoDB collection using the MongoDB Find API. |
| DataLayer.Mongo Map Reduce | Runs a MongoDB map-reduce operation to return one or more documents. |
| Attributes | Runs a MongoDB command, suitable for use with the Aggregation Pipeline, a simpler alternative to using map-reduce operations, to return one or more documents. |
| DataLayer.Plugin | Retrieves data from a custom-written code module, the "plug-in". |
| DataLayer.REST | Retrieves data from a REST-style web service. |
| DataLayer.Scheduler | Retrieves data associated with the Logi Scheduler service. For more information, see Use Logi Scheduler. |
| Data Layer.Simple DB | Retrieves data from Amazon's SimpleDB web service. |
| DataLayer.SP | Retrieves data from a SQL database, using a Stored Procedure. |
| DataLayer.SQL | Retrieves data from a SQL database, using a SQL query. |
| DataLayer.Static | Uses hard-coded data values. |
| DataLayer.Twitter | Retrieves tweets and messages from the Twitter web site. |
| DataLayer:Web.Feed | Retrieves data from an RSS or Atom web feed. |
| DataLayer.Web Scraper | Retrieves data from within web pages or HTML files. |
| DataLayer.Web Service | Retrieves data from a SOAP-style web service. |
| DataLayer.XML | Retrieves data directly from an XML data file. |
| DataLayer.XOLAP Query | Pre-defines a data view based on a Logi XOLAP cube. |
The type of datalayer used often matches the type of Connection element used in your _Settings definition. Some datalayers, such as DataLayer.CSV and DataLayer.Excel, directly access the web server file system and may not require a connection.
In v10.2.224+, Data Engine performance, when processing large numbers of DateTime-type columns in a result set, can be significantly improved by skipping Time Zone processing. This is done using a special constant in the _Settings definition:
rdSQLIncludeGMTOffset = False
However, this feature does not offer improved performance with small numbers of DateTime columns.
In v11.0.416, the Connection.HTTP element was introduced, allowing the following datalayers to optionally use a connection to an HTTP or HTTPS datasource that requires authentication:
|
|
Using the Data
Logi reporting products are XML-based and the reporting engine converts data retrieved from any datasource into XML. Each row from the datasource is equivalent to one XML element and each column is equivalent to one XML attribute. For example, a data table containing four columns and nine rows is equivalent to nine XML elements, each with four attributes.
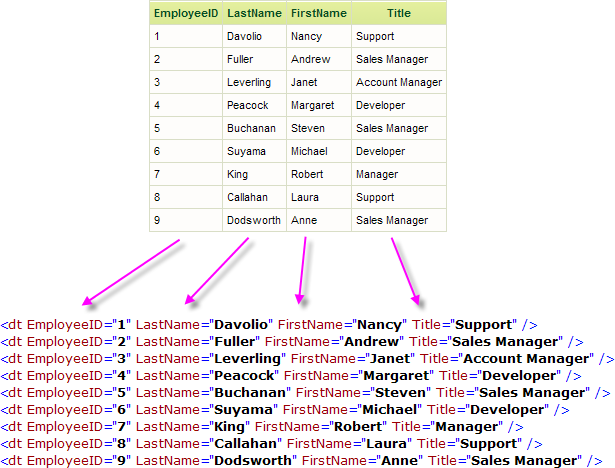
The example above shows the datalayer XML produced from a query to the Northwind database. The query was:
SELECT EmployeeID, LastName, FirstName, Title FROM Employees
Data retrieved into the datalayer is cached in XML format in memory and/or on the web server's file system. The latter is discussed in The Logi Server Engine and may be of interest to developers working with extremely large datasets or large numbers of concurrent users.
Data retrieved into the DataLayer.XML File and DataLayer.Web Service elements may need to be reformatted for use, and the XslTransform element is available for this purpose.
In v11.0.416, support for "bracketed" column names, such as "[Order Date]", was introduced. The brackets allow column names to include spaces, special characters, or SQL reserved words.
The data retrieved with a datalayer is available using @Data tokens, in the format @Data.ColumnName~. The spelling of the column name is case-sensitive.
For example, @Data.LastName~ retrieves all values, in all rows, for the LastName column. This might sound as if you get all the data in one place in your report but you don't. When the reporting engine generates the report, it iterates through each row in the datalayer; the @Data token at any point in time represents the value in a column for the current row in the iteration.
You can see the actual XML data after it's been retrieved for any report in the Debug Trace Report; see Debug Reports to learn more about troubleshooting datalayers.
Data Scope and Local Data
The availability of data is generally limited to the container (Data Table, Chart, etc.) which is the parent element of the datalayer element used to retrieve the data. The following example illustrates the use of multiple datalayers and the availability of their data.
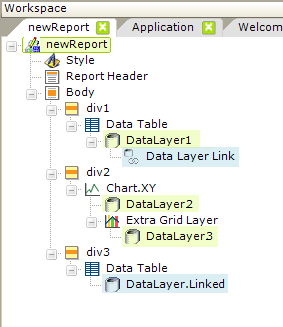
- The Data Table element within the div1 division uses data from DataLayer1 datalayer.
- The Chart.XY element within the div2 division uses both the DataLayer2 datalayer and the DataLayer3 datalayer, but does not have access to data in DataLayer1.
- The Data Table element within the div3 division uses the data from DataLayer1 by virtue of the two elements, Data Layer Link and DataLayer.Linked, which link it to the datalayer.
Linking datalayers is a very useful practice, allowing the data retrieved into one datalayer to be available for re-use in another. This eliminates extra datasource queries and improves performance. For more information, see Link Datalayers.
A special data container element, Local Data, can be used to make data available anywhere within the report:
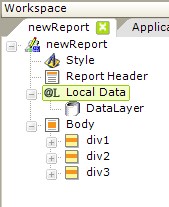
As shown above, Local Data is a child of the report root element, not of the Body or other lower elements. The data retrieved by Local Data's child datalayer is accessed using a special @Local tokens, in the format @Local.ColumnName~. These tokens can be used anywhere in the report, and this is an excellent way to use data, for example, in headers and footers.
There is a caveat, however: @Local tokens can only access the first row of the data. Local Data is particularly useful, therefore, for "lookups" that return a limited amount of data.
Multiple Local Data elements can be used in the same report definition and they will run sequentially, not simultaneously, so that data from one can be used in the query of another. In the data retrieved, the effect is a "union" of all of the Local Data data.
You can use the linking elements shown earlier to link the Local Data datalayer to other datalayers in the report definition, which then provides access to all rows of data in the Local Data datalayer. However, the linked data will then be subject to the same rules as those for any other datalayer (scope limited to parent element and accessed using @Data tokens).
Local Data datalayers are run before other datalayers, so data from them can be used to condition the retrieval of data by other datalayers. In versions prior to 10.0.319, Local Data re-runs its datalayer every time any element in the report is refreshed; this may have performance implications and make it less desirable.
In v11.0.416, Local Data behavior was changed so that its datalayers are not re-run with all AJAX refresh requests. They are only re-run when the element being refreshed contains either a DataLayer.Linked element linked to the Local Data datalayer, or when it contains an @Local token.
Beginning in v10.0.319, the Local Data element was given a Condition attribute. If the value of this attribute is left blank or contains a formula that evaluates to True, then the element's child elements (its datalayers) will run. If the value evaluates to False, the element is ignored and the datalayers are not run. This allows developers to dynamically determine when the Local Data should be run, or re-run if a page is refreshed (in this case, a @Request token can be used in the formula in the Condition attribute).
Manipulating the Datalayer
Once data has been retrieved into a datalayer, a number of elements can be used to manipulate its data. This is generally done by either re-arranging rows, removing rows, or by adding columns to the datalayer. These elements are summarized below; the links direct you to individual documents that discuss the use of each element:
| Element | Description |
|---|---|
| Aggregate Column | Adds a new column to the datalayer that aggregates data from another column. Functions include Average, Count, DistinctCount, Max, Median, Min, Mode, Sum, and StdDev. For more information, see The Aggregate Column. |
| Calculated Column | Adds a new column to the datalayer whose data is the result of a formula that uses data from other columns in the same row or other token values. For example, multiplying the values from two columns together. VBScript or Javascript functions are supported in formulae (based on script language setting in _Settings definition). |
| Color Spectrum Column | Adds a new column to the datalayer, containing color values that fall between the LowValueColor and HighValueColor attribute values. The color for each row is generated based on where the current Data Column value falls between the Min Range and Max Range |
| Compare Filter | Analogous to the WHERE clause in a SQL query, this element removes rows from the datalayer that do not meet specified criteria. Uses native data engine code for fastest performance. Logi Info only, introduced in v10.1.18. For more information, see The Compare Filter. |
| Condition Filter | Similar to the Compare Filter, this element uses scripting to remove rows from the datalayer that do not meet specified criteria. For more information, see The Condition Filter. |
| Contain Filter | Analogous to using a WHEREx CONTAINS y clause in a SQL query, this element removes rows from the datalayer that do not return results in a text search of specified columns. Logi Info only, introduced in v10.1.18. For more information, see The Contain Filter. |
| Crosstab Filter | "Pivots" the data to convert the datalayer into a "cross-tab" format. |
| DeDuplicate Filter | Analogous to using a DISTINCT clause in a SQL query, this element removes rows from the datalayer that have duplicated values in specified columns. Logi Info only, introduced in v10.1.18. For more information, see The DeDuplicate Filter. |
| Difference Column | Adds a new column to the datalayer that contains the difference, as a number or as a percentage, between a numeric value in a column in the current and the previous rows. |
| File Column | Used with BLOBs and CLOBS, this element copies the column data and saves it to a file, then optionally adds columns to the datalayer containing the saved file's name and path. For more information, see The File Column. |
| Flattener | Processes hierarchical data into a tabular set of rows and columns, so that it can be used with a range of Logi elements. Introduced in v11.2.040. For more information, see The Flattener. |
| Forecasting Elements | Forecasting elements use a variety of techniques to produce projected values by analyzing existing values. The future values they "predict" are, in most cases, added as rows or columns to a datalayer so the data can be displayed along with the existing data. Logi Info only, introduced in v10.0.479.. |
| Formatted Column | Adds a new column to the datalayer that represents the source value after formatting. For more information, see The Formatted Column. |
| Group Filter | Groups rows in the datalayer based on one or more column values and allows group aggregate values to be created. For more information, see The Group Filter. |
Join | Analogous to a JOIN clause in a SQL query, this element adds columns to the datalayer so that multiple tables can be joined to create a single dataset. For more information, see Join Datalayers. |
| Lookup Element | Performs a "look up" of related data. It runs its own datalayer once for each row in its parent datalayer and automatically joins the results. Logi Info only, introduced in v10.1.18. For more information, see Lookup Element. |
Moving Average Column | Adds a new column to the datalayer based on the average value of another column spread over some number of previous rows. Used to smooth data series and make it easier to spot trends. |
| Percent of Total Column | Adds a new column to the datalayer containing the percentage of some value in the row compared to the total of that value in all rows. |
| Rank Column | Adds a new column to the datalayer containing either a numeric or percentile rank based on all the values of some other column. |
| RegEx Filter | Removes rows from the datalayer by applying pattern matching using regular expressions. Logi Info only, introduced in v10.1.18. For more information, see The RegEx Filter. |
| Relevance Filter | Removes rows (irrelevant data) from the datalayer that do not meet a threshold; optionally, irrelevant rows can be retained, grouped together, and handled as an individual entity. For more information, see The Relevance Filter. |
| Remove Columns | Removes one of more columns from the datalayer to reduce the size of the data during processing. If a column is no longer required, you can use this element to delete it. |
| Running Total Column | Adds a new column to the datalayer containing values based on the sum of all previous values of another column. |
| Security Filter | Removes rows from the datalayer, like a Condition Filter, but is applied based on a user's security rights. For more information, see the Secure Data section of Work with Logi Security 10. |
| Sequence Column | Numbers the rows in a datalayer by adding a new column containing a sequence integer for each row, starting at 1. Also useful for counting the number of datalayer rows. |
| Sort Filter | Sorts the datalayer rows. For more information, see The Sort Filter. |
| Switch Column | Makes data replacements. It's analogous to using both a CASE structure and a REPLACE function in a SQL query. Logi Info only, introduced in v10.1.18.. For more information, see The Switch Column. |
| Time Period Column | Adds a new column to the datalayer containing a time period value (Year, Month, Day, Hour, Minute, etc.) parsed from another column's date-time value. Eliminates the need to parse date-time values using Calculated Columns and script functions. For more information, see Time Period Columns. |
| UnCrosstab Filter | Used to "un-pivot" or "reverse pivot" rows of data into columns of data, it converts one row of multi-column data into multiple rows, each with a single data value. Logi Info only, introduced in v10.1.18. For more information, see The UnCrosstab Filter. |
| Unit Conversion Column | Converts column values from one standard measurement to another. Logi Info only, introduced in v10.1.18. For more information, see The Unit Conversion Column. |
Columns that are added to a datalayer using these elements are then available for use and subsequent manipulation themselves, like any other datalayer column, and their values are available using @Data tokens.
The Include Condition Attribute
Beginning in v10.0.319, all of the datalayer manipulation elements listed in the table above have an Include Condition attribute. If the value of this attribute is left blank or contains a formula that evaluates to True, the element is applied to the datalayer. If the value evaluates to False, the element is ignored and does not affect the datalayer. This powerful feature allows developers to dynamically determine if the datalayer will be manipulated or not.
Datalayer Element IDs
Element IDs were required for datalayers through v10.1.46, after which they became optional. However, you may want to always provide a unique datalayer element ID, for ease in understanding the definition and, significantly, so that the datalayer is easily identified in the Debug Trace page.
Datalayer Error Handling
The If Data Error element, introduced in v10.0.319, allows developers to handle errors, such as a failure to find or connect to data sources, or missing or corrupt data files, that may occur while retrieving data into a datalayer. In this way, errors are trapped and processing can be switched to alternate data sources, instead of displaying the system error page.
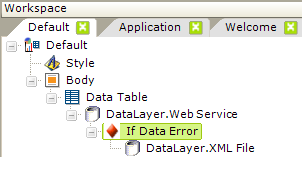
Consider the example shown above. A Data Table normally uses a Web Service to retrieve the latest currency conversion information. However, if there is some problem with the web service and an error occurs, the If Data Element allows the datasource to switch to an XML data file. In this way, data is still presented and an error page is not displayed.
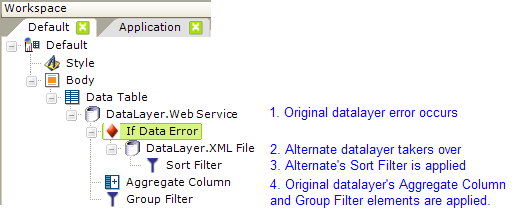
What about any data manipulation elements that may exist? As shown above, when an error occurs, the alternate datalayer replaces the original datalayer as the data retrieval mechanism and applies its own data manipulation elements. Then the application will process any data manipulation elements for the original datalayer.
You may use multiple, nested If Data Error elements. The Debug Trace page will include an entry containing the actual error message and any details generated each time an If Data Error element is processed. The @Function.ErrorDataLayerID~ token can be used to determine the element ID of the datalayer that encountered the error.
Usage Examples
Datalayer elements are available for various table, chart and user-input elements. In Studio, the Element Toolbox Panel displays all the datalayer elements when an appropriate parent element is selected. The following three examples illustrate common uses of datalayers.
Using Hard-Coded Data in an Input Select List
Hard-coded values can be used with the DataLayer.Static element:
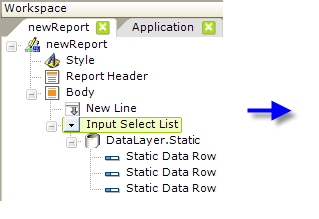
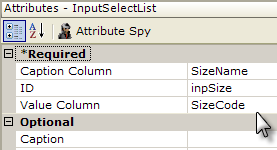
In the example above, the user should be able to select garment sizes from a drop-down list. Hard-coded data makes sense here because the standard sizes (Small, Medium, Large) are few in number and static. To make this functional:
- Add the Input Select List element to the definition, as shown above.
- Beneath it, add a DataLayer.Static element, which has no attributes, and three Static Data Row child elements, one for each choice (garment size) in the drop-down list.
- Set the Input Select List element's attributes as shown above. The values for the Caption Column and Value Column attributes are an arbitrary names ("SizeName" and "SizeCode") that will be referenced in the next step.
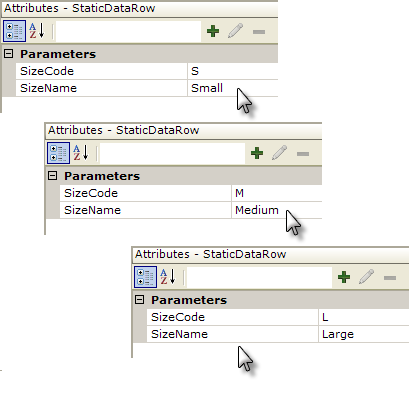
- Set the attributes for each Static Data Row elements as shown above, one element for each size.
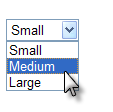
When the report is run, the datalayer will get its displayed options (the "Caption") and related values from the Static Data Row elements and the Input Select List will display them.
Using XML File Data in an Input Select List
The DataLayer.XML File element is used to retrieved from an XML file. This approach is useful when there is a substantial amount of data and, though generally static, it may change someday and/or being able to edit the data outside of the report definition is desirable. In this example, the user will be able to select a currency from a drop-down list.
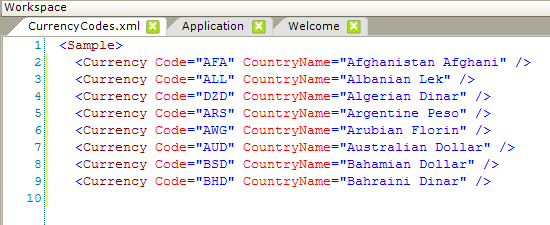
The currencies are contained in CurrencyCodes.xml, part of which is shown above, and which should be added to the application's Support Files.
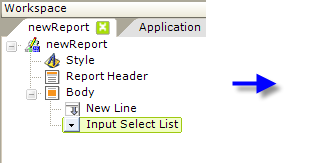
- Add the Input Select List element to the definition, as shown above.
- Beneath it, add a DataLayer.XML File element.
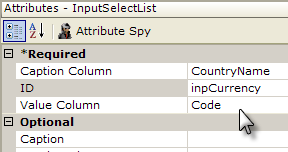
- Set the Input Select List element's attributes as shown above. Note that the values for the Caption Column attribute and Value Column attribute correspond to the attribute names in the XML file.
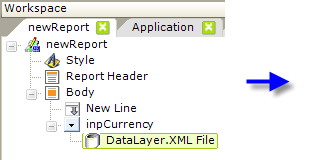
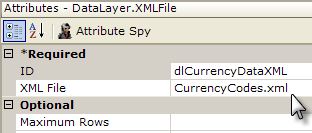
- Set the DataLayer.XML File element's attributes as shown above.
When the report is run, the datalayer will read all of the values from the XML file and the Input Select List will display them. If this report calls another report or process, based on the attributes set above, in that report the @Request.inpCurrency~ token will contain the value from the XML file's Code attribute. So, selecting the Australian Dollar in the select list will result in the value "AUD" being passed to the next report.
Using Datalayers to Retrieve SQL Data
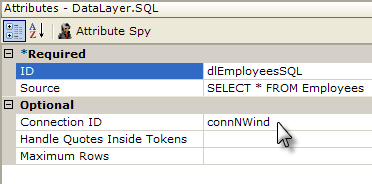
DataLayer.SQL runs a SQL query to retrieve data from a SQL datasource. The element's Source attribute value is the actual SQL statement, and any valid SQL statement (or statements) will be run.
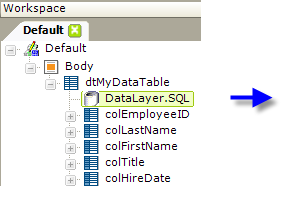
The example above shows a simple SQL query that returns data to a simple data table.
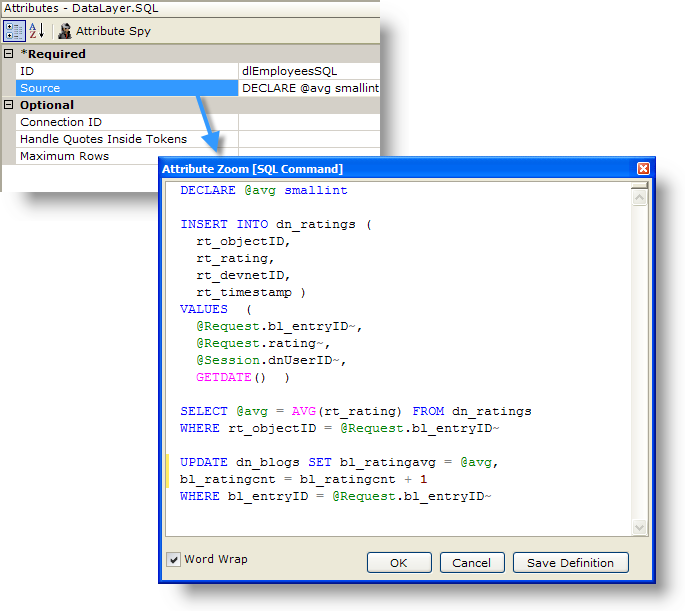
However, as shown in the example above, the Source attribute value (opened in the Attribute Zoom Window) can consist of multiple SQL statements. They will all be executed, as long as the syntax is correct, and any results will be returned to the datalayer. The Attribute Zoom window is opened for any attribute by double-clicking the attribute name.
While the multi-statement capability makes it easy to use them, your best performance for complex SQL queries and best security is still to be found by using stored procedures, and the DataLayer.SP element is used to work with them:
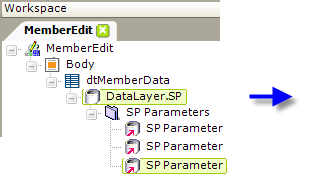
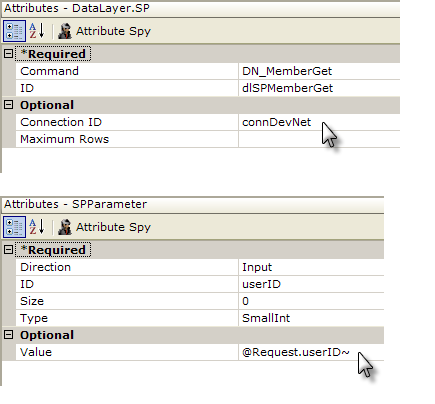
In the example shown above, DataLayer.SP is used to call a stored procedure. An SP Parameters element, and one SP Parameter element for each parameter, is used to pass arguments to the stored procedure. The result set from the stored procedure is retrieved into the datalayer.