Debug Reports
This topic introduces developers to debugging techniques for use with Logi Studio. It provides you with information about the tools and techniques available in Studio to help you understand what's happening within your application, especially if things don't work as expected. Topics include:
- Preview and Browse
- Use Comments, Remarks, and Application Notes
- Use the Test Parameters Panel
- Use the Debugging Features
- Logging Errors
Preview and Browse
A Logi application may have one or more report definition files and, while actually browsing a report shows you the big picture, doing so can be cumbersome if you have multiple definitions. Studio's Preview tab provides the developer with a fast way to view the report definition currently being edited in the Workspace Panel, without changing the Default Report attribute in the _Settings definition.
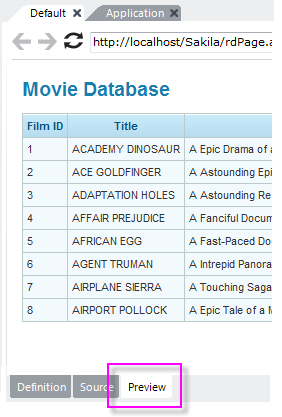
To preview a Report definition:
- In the Application Panel, select and open the report definition to preview.
- Click the Preview button at the bottom of the Workspace Panel, as shown above.
- Browse and interact with the report definition using the toolbar at the top of the Preview panel.

Logi Info developers can also test their Process definitions in a similar way:
- In the Application Panel, select and open the process definition to test.
- In the Test Parameters Panel, set values for any parameters the process task requires.
- At the bottom of the Workspace Panel, select the individual process task to test in the task list.
- Click the Run button at the bottom of the Workspace Panel, as shown above.
Use Live Preview
The Live Preview feature allows you preview your work in a separate, "live" desktop window.

The Main Menu's Live Preview item is shown above. The live preview will be displayed in a separate window and any changes made to the definition will immediately be reflected in that window. You can resize and relocate the new preview window as desired; you can even drag it onto a separate display, if you have one.
You can also switch to Live Preview from regular Preview mode:
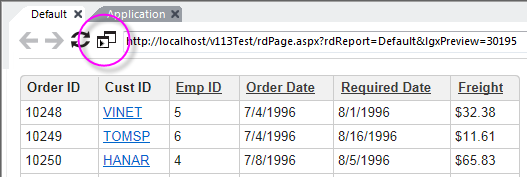
To start Live Preview, first preview the report definition, using the Preview tab, and then click the Live Preview icon, circled above.
The preview will be displayed in a separate window, and Studio will switch back to its Definition tab. You can resize and relocate the new preview window as desired; you can even drag it onto a separate display, if you have one.
Any subsequent changes you make to the definition code will immediately be reflected in the Live Preview window.

If you don't want definition changes to be updated immediately in the Live Preview window, you can pause and restart them, using the Pause and Play icons in the Live Preview window, circled above.
To exit Live Preview, just click the Live Preview window's Close (X) icon.
Browse the Default Report Definition
In a Logi application, one of the report definitions is designated
(in the _Setting definition) as the "default" report - the page that
will be shown if no definition is specified in the URL. If you don't
change it, this is usually the Default report definition.

You can browse the default report by clicking the Run Application menu item, shown above, in Studio's Main Menu, or by pressing the F5 key. Your computer's default browser (the one associated with .htm/.html file extensions) will be used for this.
You can change the "default" report designation using two methods:
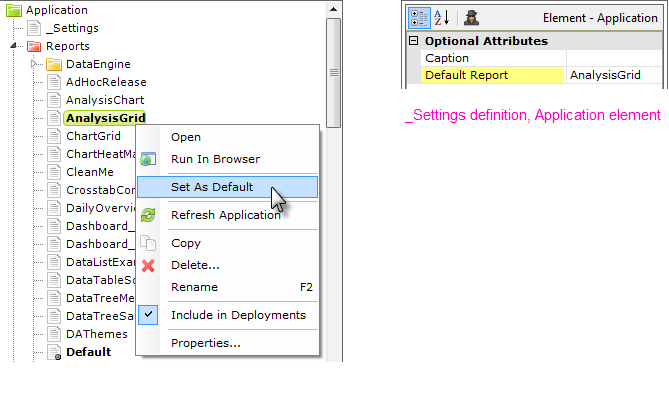
As shown above, left, in the Application panel, select the desired report definition, right-click it, and select Set As Default from its context menu. This sets the Application element's Default Report attribute, shown above, right, in the _Settings definition. You can also manually edit this attribute value directly in the _Settings definition.
Using the Run Application menu item will save all open, unsaved definitions before displaying the report.
Use Comments, Remarks, and Application Notes
As an application grows in size and complexity, it's often helpful for developers to leave in-line comments and descriptive notes within the definitions. The Note element holds these comments and can be placed anywhere in a report definition; it's ignored when the report is executed.
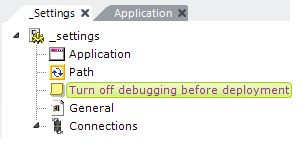
In the above example, Note elements have been placed in the _Settings definition to provide instructions for other developers. Placing the Notes in different levels of the element tree establishes context for the reader, as shown by the final Note element above. Blue is the default note text color, but you can change this using Studio's Tools ![]() Options menu
Options menu
To add a comment:
- Add the Note element to the definition, like any other, wherever it makes sense to you.
- Select the newly added Note element to define its attributes.
- Double-click the Note attribute to open the Zoom window, type your comment, and click OK.
- To prevent Notes from appearing in the generated HTML page, remark them (see below).
Remarking Events
During development, it may be helpful to temporarily "comment out" certain elements. The developer can remark a single element or an entire hierarchy of sub-elements in order to temporarily hide them from execution. This can be an important debugging tool as it allows you to selectively prevent execution of parts of the application.
A common troubleshooting technique is to remark a definition repeatedly, successively reducing it down to fewer and fewer basic parts, in order to isolate the source of a difficult-to-find error.
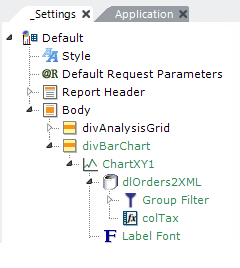
In the example above, the first Divisions in the element tree is active. The second Division element has been remarked and appears in a green font; it is therefore inactive and will not be rendered in the final HTML output. Green is the default color but you can change this using Studio's Tools ![]() Options menu.
Options menu.
Remarked elements do not affect the appearance or functionality of the application but remain present in the definition file. At runtime, the Logi Server Engine ignores remarked elements and they are not rendered into the HTML page output.
To remark an element:
- Select the element to remark from the definition file.
- Right-click it and choose Remark from the pop-up menu.
Because elements are structured in a hierarchical tree, if a parent element is remarked, all of its child elements in the tree are also remarked.
Write Application Notes
It's often useful to write detailed notes about topics that affect the entire application, such as database modifications or session variable names, and the Note element isn't useful for this purpose. Instead there's an Application Notepad for each Logi Studio application. To access it, select to the Application tab in the Workspace panel.
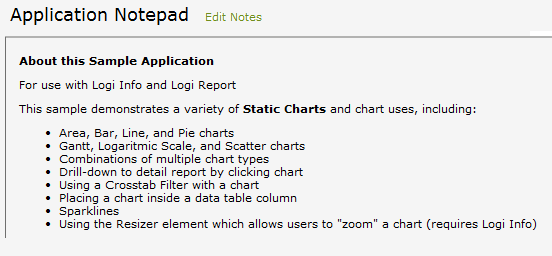
To write Application Notes:
- Click Edit Notes to begin writing the application notes.
- Type the notes in the provided textbox.
- Click Save Notes to commit the changes.
![]()
The following formatting options are available when writing application notes:
- Bold
- Italic
- Underline
- Bulleted List
- Numbered List
- Decrease Indent
- Increase Indent
- Insert Link
The Application Notes are stored in a separate .xml data file in the _Definitions folder under your application folder.
Use the Test Parameters Panel
One of Studio's least well-known panels is the Test Parameters panel. Studio makes this panel visible when the current definition expects to receive and use parameters. It provides a way for developers to supply request variable values for their definitions when previewing them in Studio, and it makes experimenting with different values very easy.
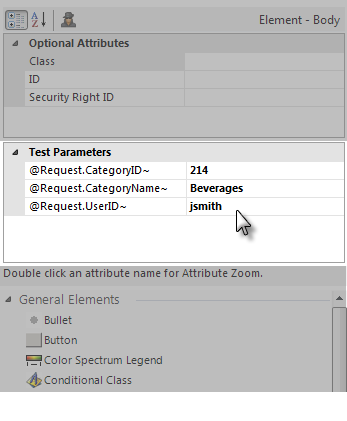
The example above shows this panel in use. Studio will automatically populate the left column with the tokens for any request variables expected by the currently selected definition in the Workspace. You can enter values for those tokens, and they'll be fed to the definition when you Preview it in the Workspace panel, or right-click it in the Application panel and select "Run in Browser".
![]() The token values in Test Parameters are not fed to the application when you click the Run Application menu item or press the F5 key.
The token values in Test Parameters are not fed to the application when you click the Run Application menu item or press the F5 key.
Use the Debugging Features
Logi Studio provides debugging features for an application, but they have to be enabled to work. They are not enabled by default.
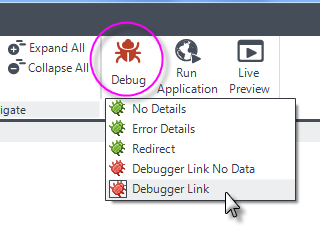
You can turn on debugging for all your report pages by clicking the Debug menu item, shown above, in Studio's main menu in the Home tab and selecting Debugger Link from the options.
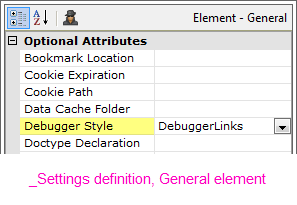
Selecting
a debugger option in the toolbar sets an attribute value in the General element, in the
_Settings definition, as shown above. This value can also be set
manually.
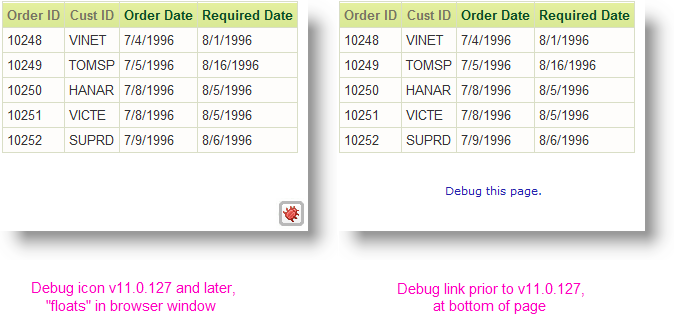
Now, when run, each report page will include a debugger link at the bottom. As shown in the examples above, the link itself changed beginning in v11.0.127. When activated, the original text link was always at the bottom of the page; the new debug icon "floats" in the lower right-hand corner of the browser window so that you don't have to scroll down to use it. Click this link to display the Debugger Trace Report (discussed below). Any charts on the page will have their own separate debugger links. You can right-click the link to open the debug page, open it in a new tab, or in a new window, etc.
Each chart will have its own debug icon or link, as well, and a separate debug trace page.
The other debugging modes include:
- Debugger Link No Data - Produces the same report as Debugger Link, but does not include links to, nor cache, the XML data retrieved. For more discussion of this option, see below.
- Error Details - Appends detailed error at the bottom of a page only when an error occurs.
- No Details - Prevents any debugger information from appearing when there's an error, so the user cannot see sensitive system security information. Use this option for system deployment.
- Redirect - Redirects the browser when an error occurs to a custom error page, at the URL you must specify in the "Redirect Error URL" attribute.
The default value is No Details.
Use Debugger Link No Data
Why is Debugger Link No Data useful? When you debug using the standard Debugger Link setting, debug data files are generated for all of the datalayer elements inside your report. Creating these files requires a significant amount of processing overhead and your reports will run slower. How much slower depends on how much data there is, but expect ~2x slower for each datalayer element.
However, if you wish to debug for performance reasons and want to inspect the timings of different events, you can use the Debugger Link No Data setting, which creates no debug data files and incurs no processing overhead, to produce a more accurate execution time profile.
About the Debugger Trace Report
When the Debugger Style has been set to Debugger Link or Debugger Link No Data, the Debugger Trace Report can be accessed in two ways: using the Debug icon or link discussed earlier, or from a link that appears on a runtime error page. The trace report appears either in the Preview panel or in your browser, depending on which method you were using to view your report.
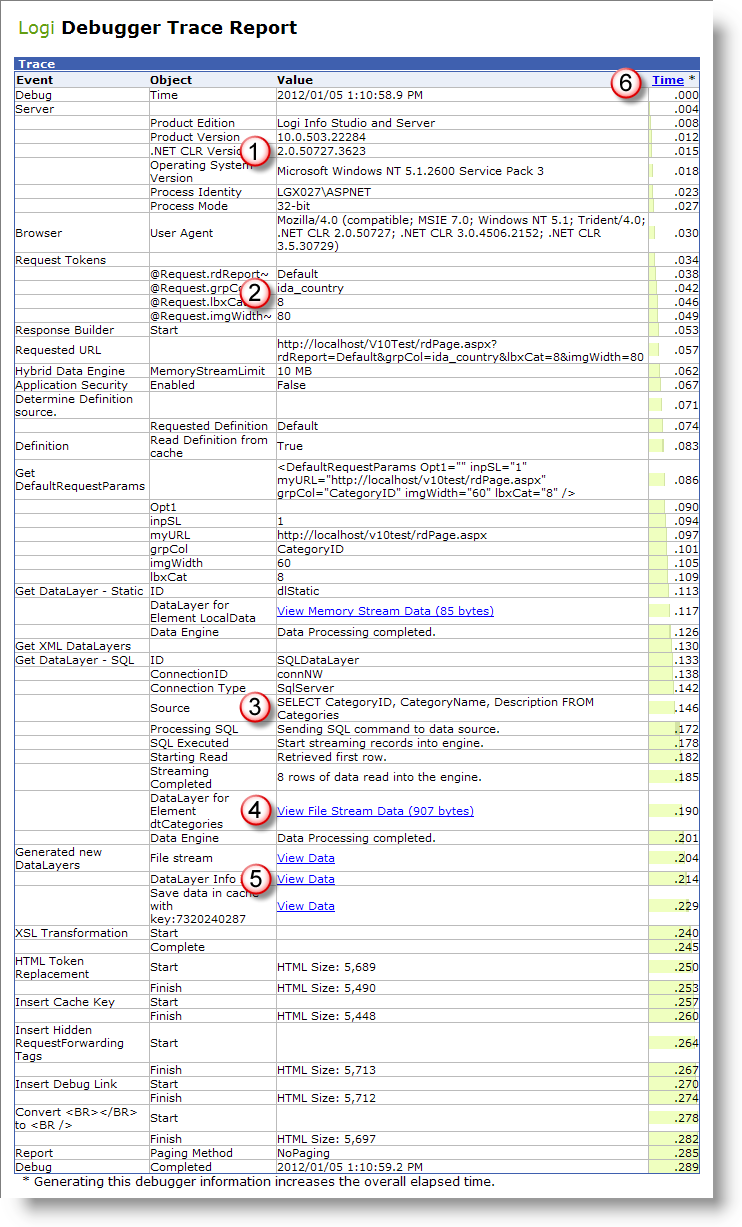
As shown above, the Debugger Trace Report, includes step-by-step events, values, and time notations for the report run. Tracing application execution is very useful for troubleshooting, especially for data retrieval issues. Here are some of the items you'll find in the trace report:
- The Trace Report shows valuable information about the system environment.
- The Trace Report shows the Request parameters being passed to the report, which can be helpful in determining what values are being passed from other reports or as a result of user input.
- Datalayer activity, such as a SQL query issued to a database, is shown. This is especially useful if some of the query includes tokens that are resolved at runtime. SQL queries shown here can be copied and pasted into Studio's Query Builder or other tools in order to run and test them independently.
Data retrieval and manipulation operations are optimized under one or more "data operation plans" to reduce data cache reads and writes. Plan information appears in this section of the debug report.
- If the Debugging Style selected was Debugger Link, you can view the underlying XML data to verify the retrieval of data from a SQL database; if the XML data is absent or incomplete, then the SQL query syntax should be examined.
- If the Debugging Style selected was Debugger Link, the data in the datalayer, after retrieval and subsequent processing with condition filters, joins, calculated columns, grouping, etc., can be viewed.
- A bar chart is integrated into the Time column, giving you a visual reference for performance during each step. You can click the Time column header to hide the chart.
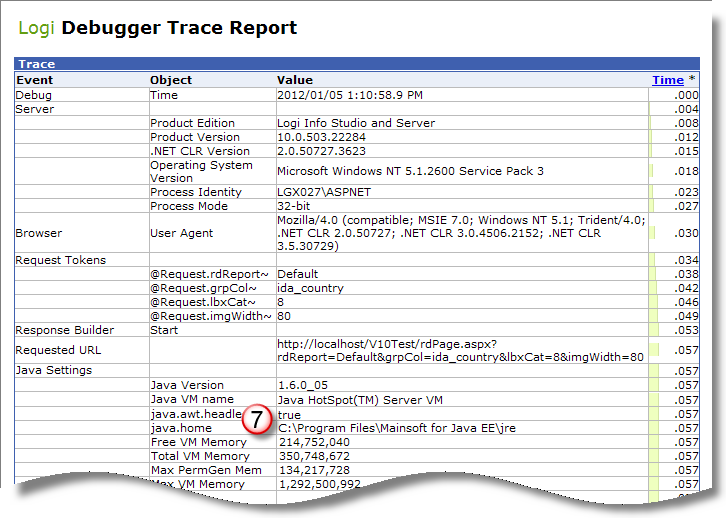
- If you're working with a Logi Java application, the Trace Report will also include a special section near the top that presents information about your Java configuration.
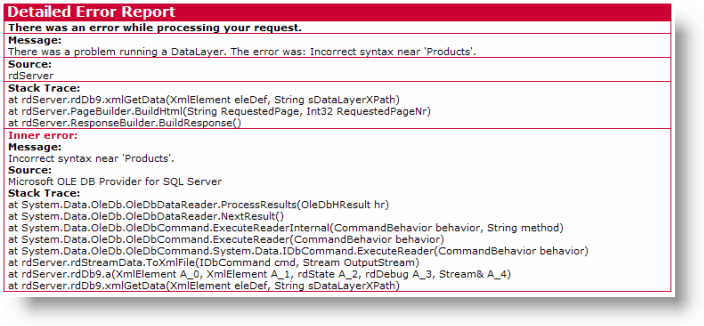
In addition, if an error has occurred, a detailed error report, shown above, including the stack trace will also appear, often with a more detailed error message to aid in debugging.
Debugging Scripts
To enable this, configure the General element's Script Source Debugger Style attribute. Its None value is the default, or you can set it to OnError, in which case the View Script File link shown above appears in the Debugger Trace Report when an error occurs. This link displays the script as generated when the report was run. If the script is a simple, single line of script, the actual error may appear here instead of a link. A third value option, Always, causes the link to appear in the trace report at all times. The routine use of "Always" is discouraged as it will incur a significant performance hit.
Logging Errors
If errors are intermittent or difficult to reproduce, then logging the errors may be a good strategy for observing them.
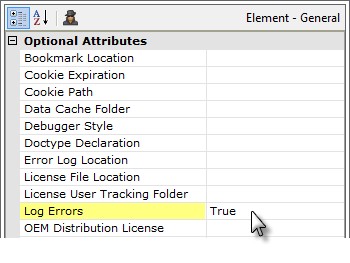
Error logging is enabled in the application's _Settings definition, as shown above, by setting the General element's Log Errors attribute to True.
This setting will write out the Debugger Trace Report as an HTML page when an error occurs. Normally, these debugger pages will be written to the <application folder>\rdErrorLog folder, which should be created automatically. If it is not created automatically, you may have to create it yourself.
You can also redirect the error logging to a folder of your choice by using the General element's Error Log Location attribute. This attribute value must be a fully qualified file path and you need to create the target folder if it does not exist. Tokens can be used here as part of the path, such as:
@Function.AppPhysicalPath~\MyErrorLogs
Keep in mind that the account used to run web applications (ASPNET for .NET apps) requires full access rights to the target folder. If the folder does not exist, then the application folder must have these rights so that the target folder, when created, inherits them.
To use a custom location in a web farm environment, specify a network folder and change the application's identity from ASP.NET to a network account.