The Group Filter
The Group Filter groups data rows in a datalayer element and gives developers the ability to create aggregate values from the records. This topic discusses use of this element.
- About the Group Filter
- Grouping Data
- Working with Group Aggregate Columns
- Using Drill-Through Features
About the Group Filter
The behavior of the Group Filter element is similar to that of the GROUP BY clause in a SQL query. However, unlike a query, the element applies its grouping to data after it's been retrieved into the datalayer. This is very useful, as it allows grouping to be applied to all kinds of data, including data from sources that lack SQL-like features, such as DataLayer.XML and DataLayer.Web Service.
Grouping Data
The following example uses a Group Filter to group data in the datalayer on a specific column:
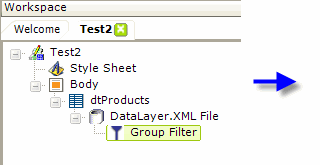
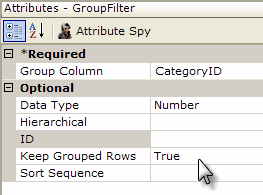
- As shown above, a Group Filter element is added as a child to the DataLayer.XML File element.
- Its Group Column attribute is set to the name of a column in the datalayer. The data will be grouped based on the values in this column.
- Its Data Type column is set to the data type of the column named in the Group Column attribute. This ensures unambiguous ordering of the data.
- Its Keep Grouped Rows attribute is set to True to ensure that all rows are retained in the datalayer.
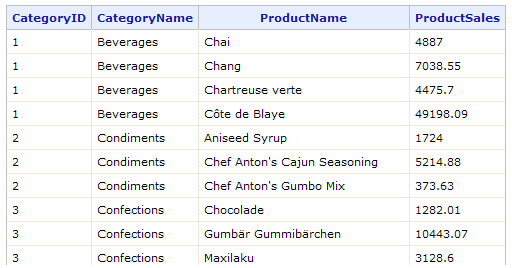
The resulting output is shown above. The rows are grouped by CategoryID and all rows for each category are included.
Grouping for Distinct Rows
There are many situations in which developers may need to use only distinct rows, for instance, to populate an Input Select List control. This can be done with grouping, as the following example illustrates:

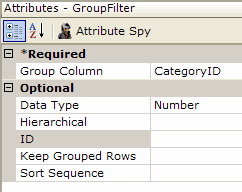
- As shown above, a Group Filter element is added as a child to the DataLayer.XML File element.
- Its Group Column attribute is set to the name of a column in the datalayer. The data will be grouped based on the values in this column.
- Its Data Type column is set to the data type of the column named in the Group Column attribute. This ensures unambiguous ordering of the data.
- The Keep Grouped Rows attribute is left blank; its default value is False. This causes all rows after the first one in each grouping to be removed from the datalayer.
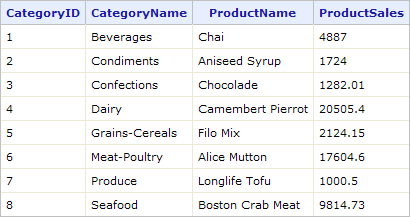
The resulting output is shown above. The rows are grouped by CategoryID but only one row exists for each category.
Grouping on Multiple Columns
Grouping can be accomplished on more than one column in the datalayer at the same time. This example shows the effects of grouping multiple columns:

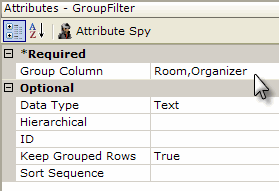
- As shown above, a Group Filter element is added as a child to the DataLayer.XML File element.
- Its Group Column attribute is set to the names of columns in the datalayer, in a comma-separated list. The data will be grouped based on the values in these columns, in the order of the column names in the list.
- Its Data Type column is set to the data type of the column named in the Group Column attribute. This ensures unambiguous ordering of the data.
- Its Keep Grouped Rows attribute is set to True to ensure that all rows are retained in the datalayer.
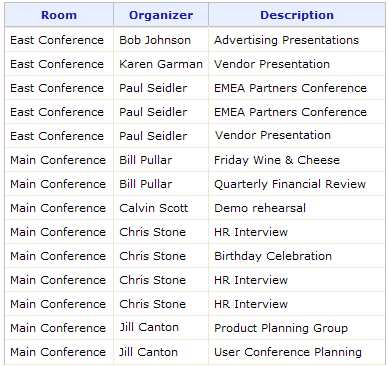
The resulting output is shown above. The rows are grouped first by Room and then by Organizer.
Conditional Grouping
Beginning in v10.0.319, the Group Filter element has an Include Condition attribute.

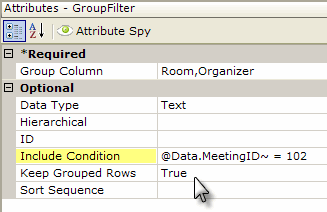
If the value of this attribute is left blank or contains a formula that evaluates to True, the element is applied to the datalayer. If the value evaluates to False, the element is ignored and does not affect the datalayer. This powerful feature allows developers to dynamically determine if the datalayer will be grouped or not.
Working with Group Aggregate Columns
A very common requirement when grouping data is to perform some kind of aggregation, such as summing or counting, providing a summary for each group. The Group Aggregate Column element gives developers the ability to generate this summary data for each grouping column in the datalayer.
The following example builds on the earlier example in the section "Grouping For Distinct Rows", creating a total product sales value for each product category:
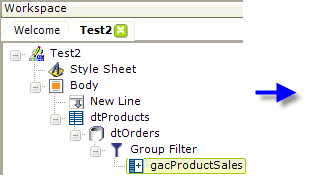
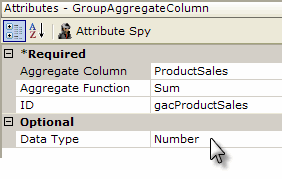
- As shown above, a Group Aggregate Column element is added to the earlier example.
- Its Aggregate Column attribute value is set to the name of the column that we want to aggregate.
- Its Aggregate Function attribute value is set to Sum. Other options include Average, Count, DistinctCount, Max, Median, Min, Mode, and StdDeviation.
 In prior versions, aggregations included columns with Null values by default. This behavior has been changed and Null values are now excluded by default. You can restore the old behavior by creating a constant, rdCalculationsIncludeNulls, and setting its value to True.
- Its ID attribute specifies the name of a new column that will be added to the datalayer, containing the summarized data values.
- Its Data Type attribute specifies the data type of the column named in the Aggregate Column attribute.
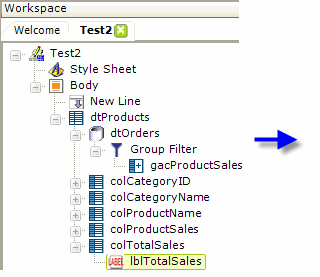
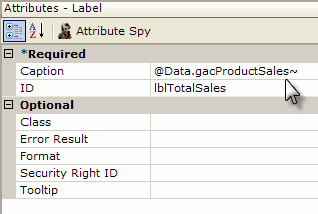
The data in the new column in the datalayer is available at runtime like any other, as shown above, through the use of an @Data token.
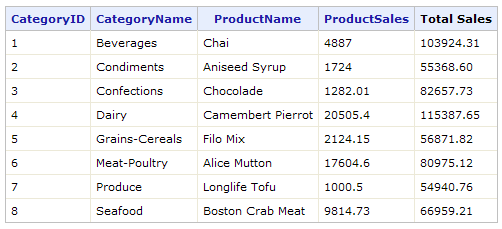
And the resulting output is shown above. All records have been grouped by CategoryID, only the first record for each group has been retained, and ProductSales values for each group has been summed and is now available in the Total Sales column.
Using Drill-Through Features
Special "drill-through" features were introduced in Logi Info, v10.0.385. These features allow you to view the data, in an automatically-generated tabular report, that was used in the grouping operation. Not available in Logi Report.
Two elements, Group Drillthrough and its optional child, Drillthrough Column, produce the view. They may be used beneath these elements:
- Data Table Column
- Crosstab Value Columns
- Chart.XY
- Chart.Pie
- Chart.Heatmap
- Chart.Scatter
Let's look at an example of them being used with a simple data table:
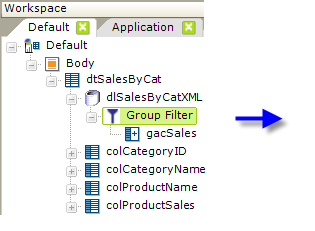
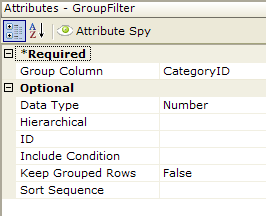
In the example shown above, a data table is used to display sales records and a Group Filter has been used to group the data by Category ID.
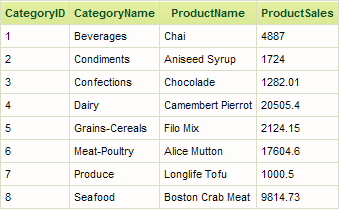
The resulting table is displayed above.
Now, if we want to drill-through the data to see what records were grouped together to produce the groupings,
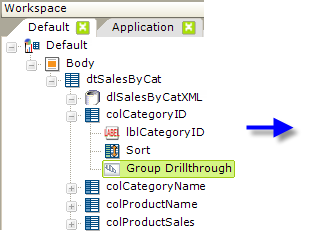
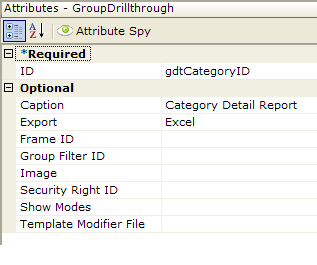
add a Group Drillthrough element, as shown above, beneath the data table column of the data used to do the grouping (Category ID). All of the element's attributes, other than ID, are optional but the example shows a custom caption and an export button selection have been entered. More information about the attributes can be found in the element's Element
Reference page.
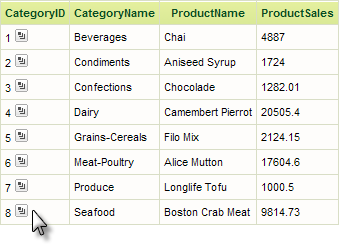
When the table is displayed, the CategoryID column will include an icon, as shown above. Starting in v10.2.110+, you have to hover your mouse pointer over the area for the icon to become visible.
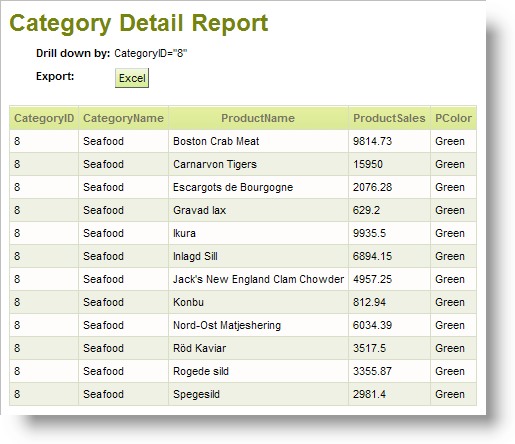
When clicked, the icon produces the detail report shown above.
The report is generated automatically and you do not need to do anything other than include the Group Drillthrough element to get the standard report. However, the element's attributes do allow you to customize the icon image and report, and, by including Drillthrough Column elements beneath it, you can set the number columns that will appear in the report and customize their appearance.