Super-Elements
Logi Info includes several pre-built, interactive "mini apps" that provide rich functionality to end users. Classified as "Super-Elements", they provide developers with instant functionality, and end-users with interactive controls that allow them to manipulate their data visualizations at runtime. This topic introduces the Super-Elements.
- About Super-Elements
- Table of Super-Elements
Super-Elements are not available in Logi Report.
About Super-Elements
Super-Elements are special collections of other elements, bound together as a single element, that produce a sophisticated "mini-application" that a developer can include in a Logi report. At runtime, users can be given access to controls that allow them to select data and construct visualizations on the fly. Developers have complete control over what data is available for manipulation and which features are available to users.

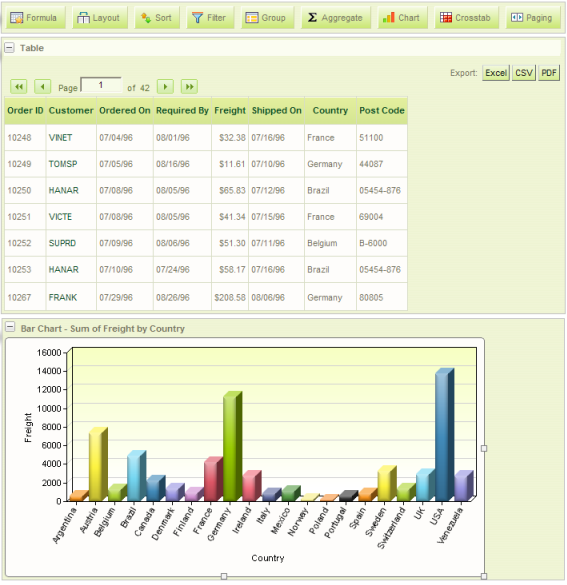
An Analysis Grid, shown above, illustrates the kinds of features available in a Super-Element. It includes user interface controls in a toolbar at the top and both a data table and a chart below. At runtime, the user can filter the data and customize the table and charts. Export controls are also available, if the developer allows them. Links for drill-downs into detail reports are supported.
In addition, most Super-Elements allow the customizations made by users to be saved between sessions and recalled later.
![]() Developers should note that you can only use one Super-Element, such as an Analysis Grid, per report
definition. Because of internal identifiers within them, using multiple Super-Elements on the same page would cause identity confusion. You can, however,
place Super-Elements in several separate report definitions and then include the definitions, as
SubReports in IncludeFrame mode, in a single master definition, resulting in the appearance of multiple Super-Elements in the same "page."
Developers should note that you can only use one Super-Element, such as an Analysis Grid, per report
definition. Because of internal identifiers within them, using multiple Super-Elements on the same page would cause identity confusion. You can, however,
place Super-Elements in several separate report definitions and then include the definitions, as
SubReports in IncludeFrame mode, in a single master definition, resulting in the appearance of multiple Super-Elements in the same "page."
Customize Super-Elements
Super-Elements make it very easy for developers to provide a lot of functionality with a minimum of development effort, while retaining control and security. Because they present an interface to the user, techniques are available for internationalizing the interface. Interface text, date formats, currency symbols, etc. can be translated into the proper culture and language dynamically, if necessary.
Almost all of the Super-Elements are built using their own "template" definitions, which are distributed with the product. Developers can modify these templates to internationalize or otherwise create custom variations of the Super-Elements. The techniques used for this purpose are described in Template Modifier Files.
Table of Super-Elements
The following table enumerates the Super-Elements. Click the element name for additional information.
| Super Element | Description |
|---|---|
| Analysis Chart | The Analysis Chart allows users, at runtime, to display non-animated charts, based on a discrete data set and limited to chart types the developer chooses to include. See Work with Analysis Charts. |
Analysis Grid | An Analysis Grid consists of separate panels for controls, configuration, data tables, charts, and cross-tab tables. At runtime, users can manipulate the controls, creating data analysis and presentation on the fly. See Work with Analysis Grids. |
Chart Grid | The Chart Grid displays a tabular arrangement of bar, line, or scatter charts, with each table cell containing a separate chart. All of the charts in the grid will be of the same type. Users can manipulate the display at runtime. See Introduction to the Chart Grid. |
Dashboard | A "dashboard" is a collection of panels containing Logi reports, which in turn contain tables, charts, images, etc. At runtime, the user can customize the dashboard by rearranging these panels on the browser page, by showing or hiding them, and even by changing their contents using adjustable reporting criteria. Dashboards can also include tabbed pages of panels. See Introduction to the Dashboard. |
Dimension Grid | The Dimension Grid element is a data table with interactive controls and charting options that allows the user to "slice and dice" data from a Logi XOLAP cube, at runtime. See Logi XOLAP. |