Map Polygons
If you've used Google or Leaflet maps to provide geographic mapping solutions in your Logi application, you can take advantage of another advanced feature, Map Polygons. In Logi Info, this allows you to overlay solid or semi-transparent, color-coded polygons on a map, for enhanced analysis.
The following topics discuss the use of Map Polygons:
- Implementing Map Polygons
- Creating a Map with Polygons
- Adding Drill-down Capabilities
- Tools for GIS Data Conversion
- Using Data from SQL Server
- GIS Data Resources
If you haven't already, you should first read Leaflet Maps or Google Maps, which provide general information.
Interested in plotting lines on the map? See Google Map Polylines.
About Map Polygons
![]() Prior to v12.5, the element being discussed in this topic was called "Google Map Polygons". However, with the introduction of Leaflet maps, the "Google" part of the name was dropped. The element works in the same way for either mapping system.
Map Polygons, plotted onto the map, are overlays or "regions"that can be color-coded based on data
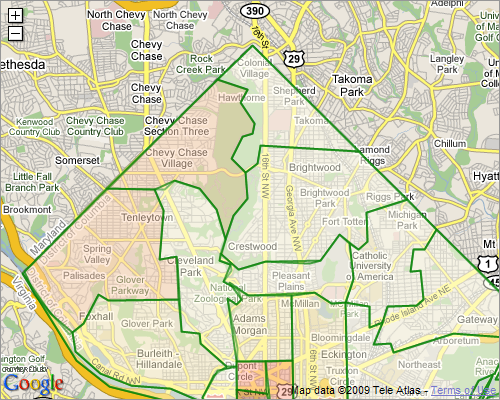
values. Here's an example:
Prior to v12.5, the element being discussed in this topic was called "Google Map Polygons". However, with the introduction of Leaflet maps, the "Google" part of the name was dropped. The element works in the same way for either mapping system.
Map Polygons, plotted onto the map, are overlays or "regions"that can be color-coded based on data
values. Here's an example:

The map above shows the northern half of Washington, D.C. with polygons representing different postal codes overlaid on it. The color of the polygon denotes the number of banks located within the region. The polygons have been configured to be semi-transparent, so that geographic features, such as streets, can be seen through them.

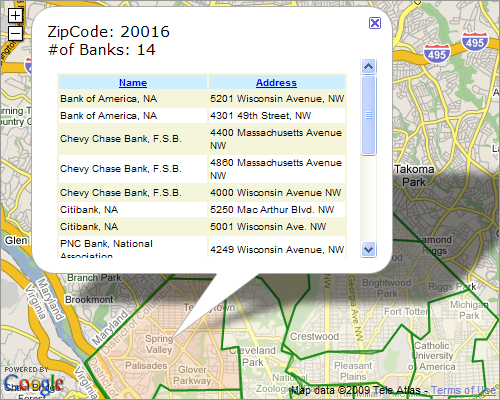
Polygons function like traditional Map Markers and can be related to other data. In the example above, they've been configured so that when they're clicked, a pop-up information panel is displayed containing more detailed information. Polygons and Map Markers can be used in the same map.
Other examples of geographic polygons include political boundaries (such as states, counties, and cities), school districts, voting districts, and water management districts, to name but a few.
Geographic Area Boundary Data
Polygons are
plotted using sets of latitude and longitudepoints that describe the boundaries of geographic areas. For use with Logi elements, these typically come from
GPX or KML files, which are GIS industry-standard XML data files. Special datalayers are provided in Logi Info to read these files. Because of the public nature of many of these geographic areas, their boundary data is often freely available on the Internet.
Area boundaries are also widely available in shapefiles, a popular geospatial vector format for
GIS data. Free and inexpensive software tools, discussed in GIS Data Resources, are available for converting shapefiles into GPX or KML data files.
Geographic data can also be retrieved from SQL database tables using DataLayer.SQL - see Using Data from SQL Server for more information.
General Features
The following describes additional features of Map Polygons:
- Borders, fill colors, and transparency level are all configurable and may be set from data values.
- Colors may be set in steps or as smooth color spectrums based on minimum and maximum data ranges.
- Polygons may be included or excluded based on data values.
- Polygon resolution is adjustable, and is dynamically sharpened as the user zooms the map in or out.
- Maps are initially displayed at a location and zoom level that shows all polygons.
- A special color spectrum legend element can be displayed below or alongside the map.