Creating a Map with Polygons
The following examples show an implementation using Google Maps, but the child elements described are used identically for a Leaflet Map. Before starting to create an application that uses Google Maps, you must get a Google Maps API Key, in order to access the Google web service. Google Connections provides information about getting and configuring an API Key. The example begins below with the assumption that you've gotten an API Key and that you've configured a Connection.Google Maps element in your _Settings definition with it.

- In your report definition, add and configure a Google Map element to use your Google Map connection.
- Beneath it, add a Map Polygons element, as shown above. This configures the polygons that will overlay the map and its Border and Fill attributes affect the appearance of the polygons. We'll come back later to set the Fill Color attribute.

- Beneath the Polygon element, add a DataLayer.Gpx File element, as shown above. It directly reads the GPX file we saw earlier to get the GIS data defining the boundaries of the state's school districts. If you're working with KML files instead, there's also a DataLayer.Kml File element for reading them. Tokens like @Function.AppPhysicalPath~ can make it easier to identify a file stored within your application folder.
 Or, add a DataLayer.SQL File element to the Polygon element if you are working with WKT formatted polygons and/or multipolygons.
- Beneath the datalayer, add a Calculated Column, as shown above. This column is used to compensate for the fact that the school district names are formatted differently in the two data files examined earlier. The complete formula attribute value is:
Replace("@Data.desc~", " COUNTY SCHOOL DISTRICT", "")
which truncates the data, creating an additional datalayer column that contains only the district name.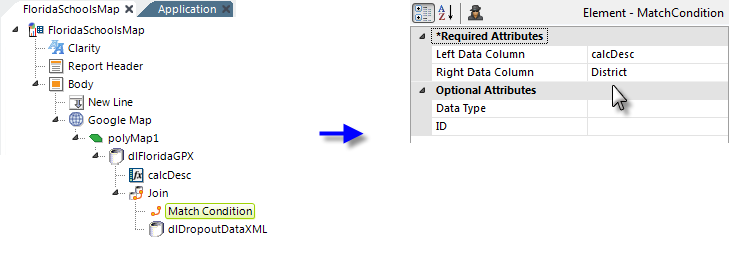
- Next, add a Join element, a DataLayer.XML element and a Match Condition element, as shown above. The Join element is configured as an Inner Join and the datalayer retrieves data from the XML file with the dropout data we saw earlier. The Match Condition element is configured as shown above, relating the District column in the XML file with the calculated column calcDesc created in the previous step from the GPX file data.
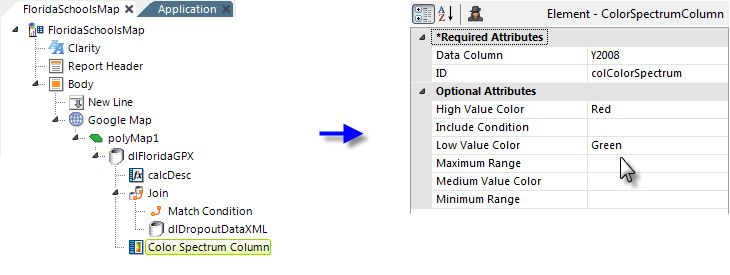
- Select the DataLayer.Gpx File element ("dlFloridaGPX") and, beneath it, add a Color Spectrum Column element, as shown above. This column will contain the color value for each row in the datalayer, determining the color for each polygon on the map.
The Data Column attribute value should be set to the name of the column with the data for the year we want to compare, 2008, and the color attributes are set to provide a color that ranges between Red and Green based on the dropout rate. Make a note of this element's ID attribute value, which will be used in the next step.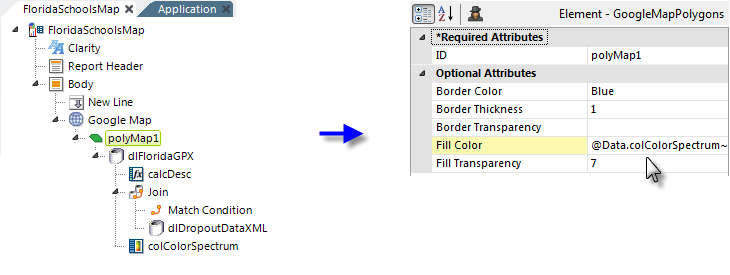
- Reselect the Map Polygons element ("polyMap1"), as shown above, and set its Fill Color attribute value to the data token for the Color Spectrum Column added in the previous step.
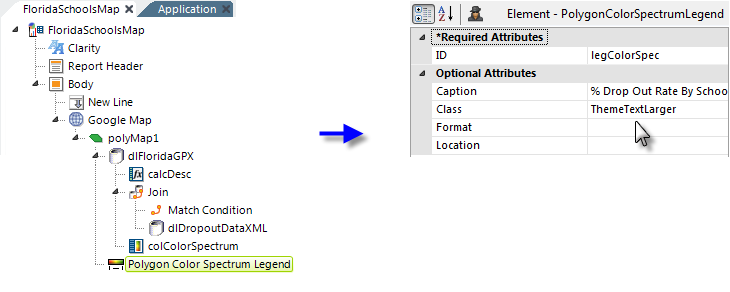
- Finally, beneath the Map Polygons element, add a Polygon Color Spectrum Legend element, as shown above. This will create a color gradient legend beneath the map.
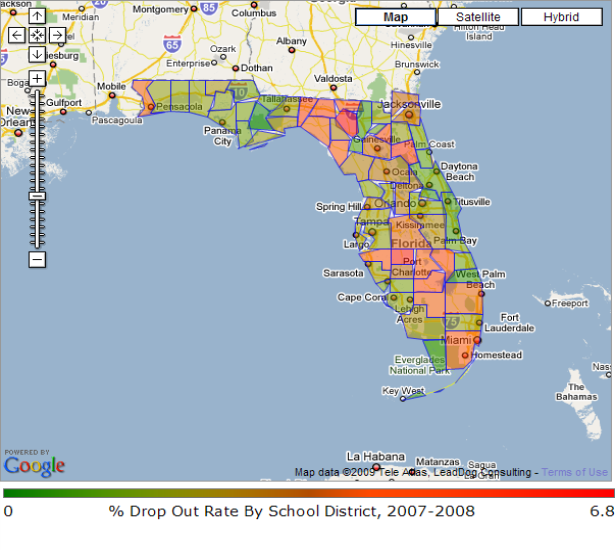
The resulting map looks like the example shown above. The map behaves like any Google Map and can be zoomed and re-centered. This topic continues on page two, with an example showing how to add drill-down capabilities to the polygons.