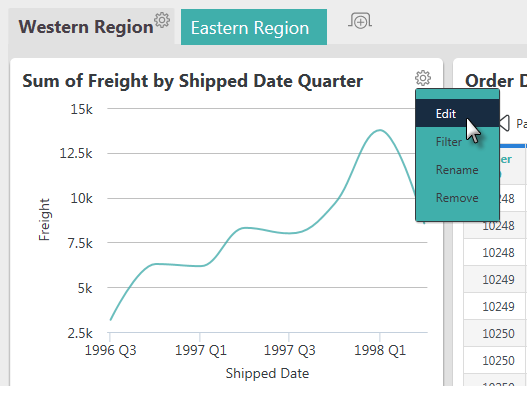
Editing Visualizations
If your application has been configured for it, certain visualizations shown in dashboard panels can be edited and then saved.

If this features has been enabled, you'll see an Edit option in a panel's gear icon drop-down menu, as shown above. If you click that option, a pop-up panel containing the original controls used to configure the visualization will appear. You can then change the visualization and save it back into the dashboard.
This feature depends on specific things about the source of the visualization so it's possible the Edit option might be available for some dashboard panels but not for others.
![]() When editing a dashboard panel, the pop-up editing panel will contain an Analysis Grid configured with all the current settings for the panel content. You edit your panel content using it, with these restrictions:
When editing a dashboard panel, the pop-up editing panel will contain an Analysis Grid configured with all the current settings for the panel content. You edit your panel content using it, with these restrictions:
- The Analysis Grid's Filter tab will only be available when editing visualizations created in Info v12.7+.
- No new charts or crosstabs can be created when editing, so their tabs will not be visible.
- You may not delete or hide/close existing charts or crosstabs when editing them.
 When editing a visualization from the Dashboard, your Drill To state will be kept as long as there are no changes made to the column currently used by the chart. For example, if your chart displays Freight x Order Date and you edit the visualization to display Freight Sum instead of Freight Average, the breadcrumb menu will remain intact. However, if you edit the visualization to display Ship Region x Freight, the breadcrumb menu will reset. For more information about the Drill To dashboard feature, see Drill To Dashboard Data.