Google Maps
The Logi Info Google Map element allows you to include the geo-mapping features of the Google Maps web service in your reports and you can combine it with your data to produce data-driven maps.
The following topics introduce the Google Maps web service and the Google Map element:
- What's a "Web Service"?
- Getting a Google Maps API Key
- Google Map Family of Elements
- Refreshing Google Maps
- About Mapping Data
Logi Info also supports Leaflet Maps. For more information, see Leaflet Maps.
About Google Maps
As mentioned above, a Google Map is an interactive map that can use your data to identify locations and provide other features. The concept is simple: take two different data sources (your data and Google's maps) and combine them into a data-driven map.
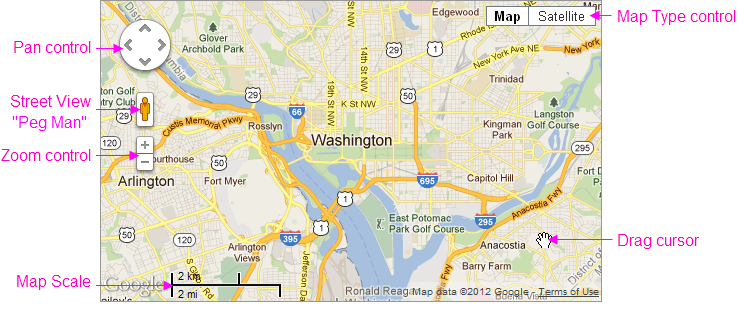
The example above shows a Google Map of the area surrounding Washington, D.C. It's a typical map depicting roads, major land features, and significant points-of-interest. The example also identifies the available optional controls, the scale for indicating map distances, and the cursor shaped that appears when dragging the map within its viewing area.
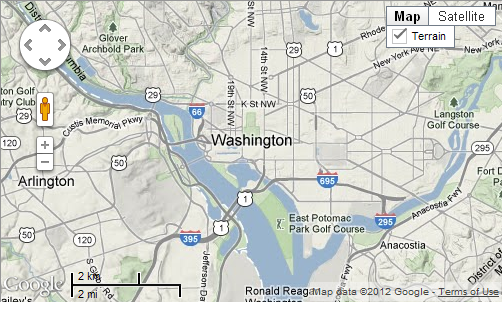
The example above shows the same map with the Terrain map type selected.
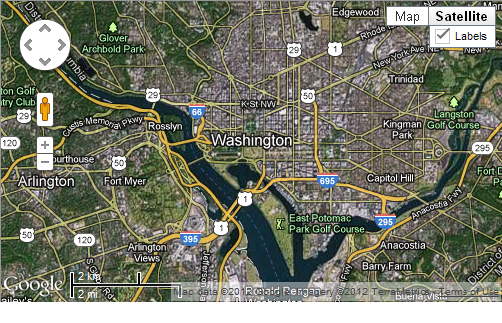
This basic example shows the same map with the Satellite map type selected.
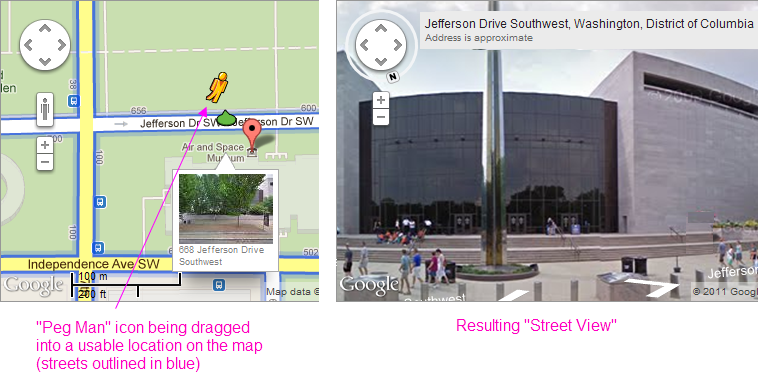
In Street View mode, Google Maps provide a street-level photographic view of a map area. Street View is engaged by dragging the "Peg Man" icon, as shown above, onto an enabled street (shown in blue when the icon is moved). Once dropped, the view switches to street-level and controls are presented allowing you to navigate and turn within the "virtual world".
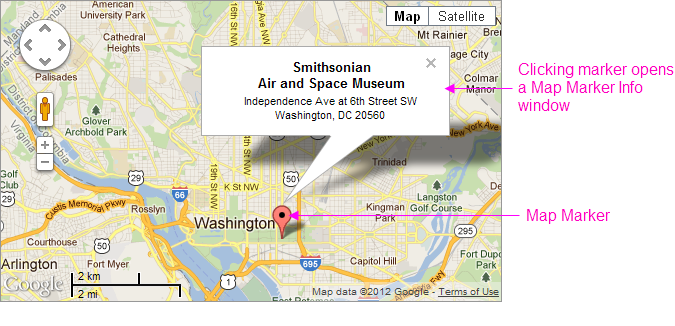
Now the basic map example above includes a "mashup" of data. When identifying data is fed to the web service, the resulting output can pinpoint locations on the map. The example above shows how a geographic Map Marker is placed on the map to identify a specific location. Map Markers can use the default icon (shown) or a custom image, gauge, or even a chart. Optionally, the map can be configured to display a Map MarkerInfo window, containing additional location-specific data, when the marker is clicked.
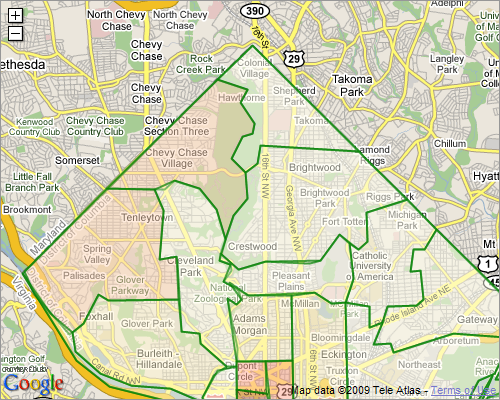
The example shown above includes data-driven, colored regions (in this case, representing postal codes), known as Map Polygons, overlaid on a map of Washington, DC. Logi Info can work with GIS boundary data to produce region overlays for states, counties, cities, school districts, and other areas. Like the Map Marker, regions can be clicked to display a pop-up information window with detail data. They're discussed in more detail in Map Polygons.
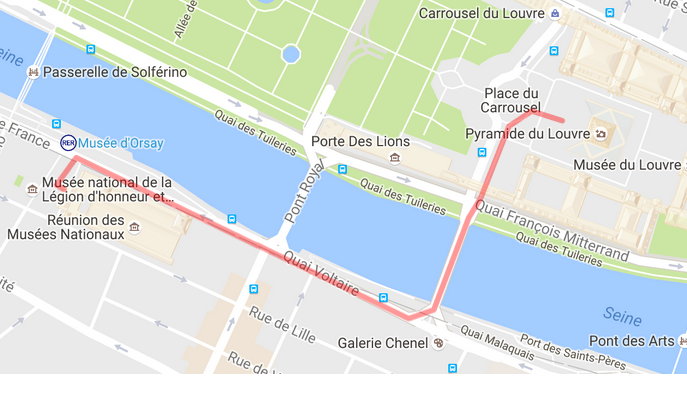
Similarly, Map Polylines can be plotted from data to show a route, in this case from the Orsay Museum in Paris to the Louvre Museum. Polyline color, width, and transparency level are all configurable and can be set from data values. For more information, see Google Map Polylines.
Google Maps can be exported to PDF. Prior to this version, they could not be exported to PDF. Google Maps cannot be exported to other formats, such as Word and Excel.