Crosstab Tables
A Cross Tabulation (often abbreviated as "crosstab") is a data table that displays the joint distribution of two or more variables simultaneously. Sometimes called "pivot tables", they make it easy to sort, count, and total their data. The Logi Crosstab Table element makes it easy to implement this kind of table.
The following topics discuss Crosstab Tables:
- Using the Crosstab Table Wizard
- Creating Crosstab Tables Manually
- Working with Crosstab Table Columns
- Arranging and Sizing Columns
- Comparing, Sorting, and Summarizing Columns
- Drillthrough to Column Detail
- Working with the Crosstab Filter
- Planning the Tutorial Crosstab Table
- Building the Basic Table Structure
- Adding Extra Crosstab Values
- Summarizing Value Rows
- Adding a Header Row
- Summarizing Value Columns
About the Crosstab Table
The Logi Info Crosstab Table element is a dynamic, data-driven reporting component that consists of the following three datalayer column types:
- Crosstab (also called Header) Column- Creates a new column in the crosstab table for each unique value. The column value appears in the table header.
- Label Column- creates a new row in the crosstab table for each unique value. The column value appears in the first (left-most) column of the row.
- Value Column- displays a value in each cell at the intersection of the Crosstab columns and Label rows (excluding the header row and first column).
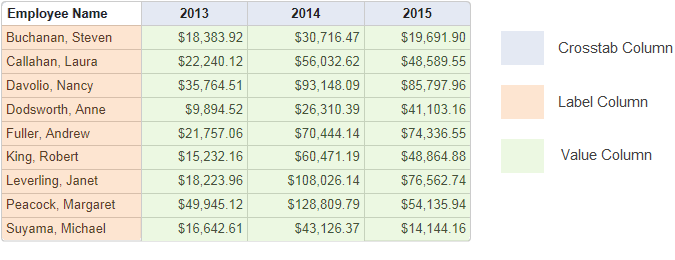
Here's how each of these data column types appear in a crosstab table:

Each value displayed in the Value Column cells is the result of an aggregation, performed on the original data from the specified Value Column. The example above displays years for the Crosstab Column, employee names for the Label Column and a sum of corresponding subtotals for the Value Columns. So, when the year is 2013 and the employee is Nancy Davolio, the sum of all corresponding subtotals is $35,764.51.
![]() To prevent creation of unmanageable tables, numeric type columns are not available for use in a Crosstab table as the Crosstab (Header) or the Label columns.
To prevent creation of unmanageable tables, numeric type columns are not available for use in a Crosstab table as the Crosstab (Header) or the Label columns.
The following functions are available for aggregating Value Columns:
- Any - Displays a value from any of the rows. This can be used when the specified Value Column data is a string that isn't appropriate for aggregation; for example, when there's just one record to represent each crosstab cell.
- Average - Returns the average of all corresponding records in the specified Value Column.
- Count - Returns the total number of corresponding records in the specified Value Column.
- DistinctCount - Returns the total number of unique corresponding records in the specified Value Column.
- Max - Returns the maximum value in the specified Value Column.
- Median - Returns the value that separates the higher half of all values in the specified Value Column from the lower half.
- Min - Returns the minimum value in the specified Value Column.
- Mode - Returns the value that occurs the most frequently in records in the specified Value Column.
- StdDev - (Standard Deviation) Returns a simple measure of the variability of data in records in the specified Value Column. A low standard deviation indicates that the values tend to be very close to each other, while a high standard deviation indicates that the values are "spread out" over a large range.
- Sum - Returns the sum of all corresponding records in the specified Value Column
![]() Columns with null values are excluded from aggregations by default. If you want to include them instead, create the constant rdCalculationsIncludeNulls in your _Settings definition and set it to True. This will affect all calculations throughout the application.
Columns with null values are excluded from aggregations by default. If you want to include them instead, create the constant rdCalculationsIncludeNulls in your _Settings definition and set it to True. This will affect all calculations throughout the application.
What about differences between columns, either as values or as percentages? The Crosstab Comparison element can display these differences in a variety of ways. The element is discussed in detail in Comparing, Sorting, and Summarizing Columns.