Working with the Crosstab Filter
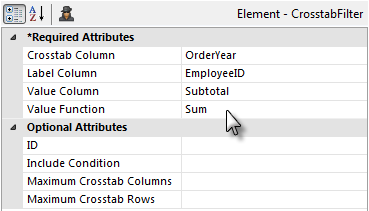
A Crosstab Filter element is required to convert, or "pivot", data retrieved into a datalayer for use in crosstab tables. In configuring this filter you specify three columns in the datalayer: the Crosstab Column, the Label Column, and the Value Column. You must also choose an aggregate function to apply to records from the Value Column.

The filter groups the data based on the designated Crosstab Column. If the Crosstab Column contains numerous distinct records, many Crosstab Value columns may be generated and the table can become quite wide. This can be controlled using the optional Maximum Crosstab Columns attribute, which limits the number of Crosstab Value columns that appear in the table.
Similarly, the Maximum Crosstab Rows attribute sets the maximum number of crosstab rows created by the Crosstab Filter. In some cases this number should be limited so that the table does not become too large in memory. The default limit is 10,000 rows.
Extra Label Columns
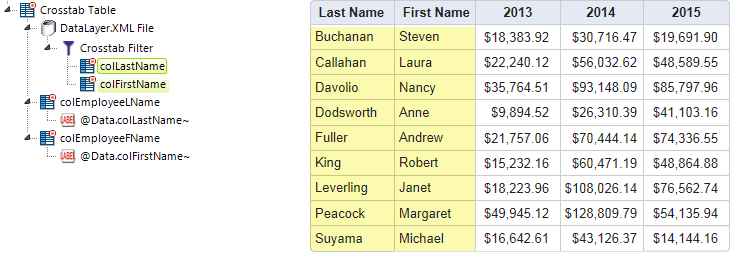
One Crosstab Table Label Column may not be sufficient to display all the necessary information in the table.

As shown above, developers can add Extra Crosstab Label Column elements beneath a Crosstab Filter element in order to add additional columns from the datalayer as Label columns.
To display the data for these extra label columns, an @Data token is used but the token identifier matches the ID of the Extra Crosstab Label Column element, not the datalayer column it represents, as shown above.
Summarizing Across a Row
In Comparing, Sorting, and Summarizing Columns we saw that you can summarize crosstab column data (a vertical summary) and display the totals in a summary row at the bottom. You can also summarize crosstab row data (a horizontal summary) and show row totals in a separate column.

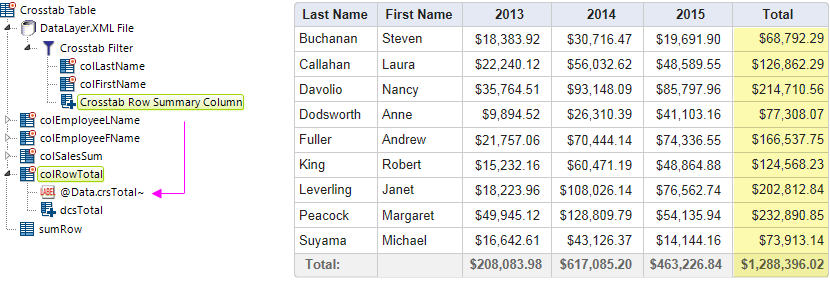
As shown above, the Crosstab Row Summary Column element can be added beneath a Crosstab Filter element to generate new columns in the filtered datalayer that contain aggregations of every value in each crosstab row.
You can specify an aggregation of Average, AverageOfAllRows, Count, CountOfAllRows,Max (v12.7), Min (v12.7), StdDev, or Sum. For example, to count the number of value columns, set this attribute to Count; in the image above there are value columns for 2013, 2014, and 2015, so the value calculated will be 3.
Additional Crosstab Table Label Column elements, such as "colRowTotal" above, can be added as needed to display the summarized results. The @Data token used to retrieve the data uses the ID of the Crosstab Row Summary Column element. So if, in the example above, the Crosstab Row Summary Column element was given an ID of "crsTotal", then @Data.crsTotal~ would be used in a Label element to display the data.
Similarly, a Data Column Summary element ("dcsTotal") can be added, configured to aggregate the "crsTotal" column, in order to total the new column vertically and include it in the Summary row at the bottom of the table.
![]() Crosstab Filters can also be used with the datalayers that provide data for charts and gauges, however, they're designed for use with Crosstab Table elements and may not provide full functionality with other elements.
Crosstab Filters can also be used with the datalayers that provide data for charts and gauges, however, they're designed for use with Crosstab Table elements and may not provide full functionality with other elements.
The Include Condition Attribute
The Crosstab Filter element has an Include Condition attribute and if the value of this attribute is left blank or contains a formula that evaluates to True, the Crosstab Filter element is applied to the datalayer. If the value evaluates to False, the filter is ignored and does not affect the datalayer. This powerful feature allows developers to dynamically determine if the datalayer will be manipulated or not.