Adding a Header Row
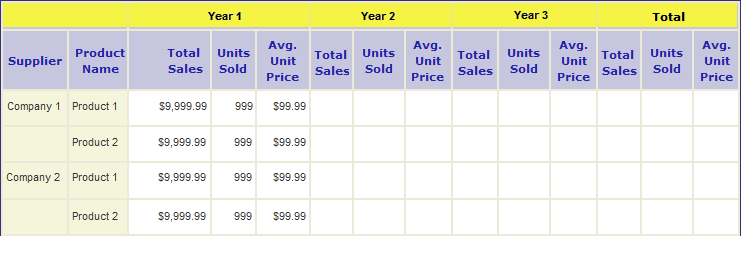
The header row ties the crosstab value columns together and provides data-driven identification for them as well. Before proceeding, look at the header on our plan: it consists of a blank area that spans two columns, three areas that will contain data (the year number) and span three value columns each, and an area labeled "Total" that spans three columns.

We'll start by adding a Header Row element to the crosstab table, as shown above, then "build-up" the row using a combination of elements. Set the Header Row element's required ID and its Header Position attribute to Top.
Next, we add a Column Cell element that will be a "spacer" or placeholder; its attributes are set to span the two columns beneath it. It contains nothing.

Next, add a Crosstab Table Header Column element, with a required ID and configured to span three columns. Beneath it add a Label element and set its Caption attribute value to the token @Data.rdCrosstabColumn~. It will display the actual data from the datalayer column identified as the Crosstab Column in the Crosstab Filter's attributes (in our example, this is "OrderYear").

Finally, add a second Column Cell element and configure it to span three columns, as shown above. Beneath it add a Label element with the word "Total" as its Caption attribute value.

The elements added in this step create the header row, highlighted in yellow above.

And the resulting table, with header, looks like the image above.