Creating Crosstab Tables Manually
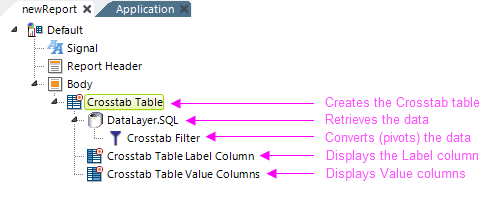
You can create a crosstab table in Logi Studio manually by adding the appropriate elements to a report definition. Every crosstab table uses the following minimum components:

- One Crosstab Table element
- One or more DataLayer elements with a Crosstab Filter element to retrieve and shape the data
- One or more Crosstab Table Label Column elements to display the Label column data
- One or more Crosstab Table Value Columns element to display the Value column data
The elements above define the most basic crosstab table. Other elements, such as Condition Filters, Sort Filters, and Calculated Columns, can be used to manipulate the data in the datalayer in the same way they would be used for any data table or chart.
If you use a Sort Filter beneath your datalayer, its effect on the table display may be different depending on its placement before (above) or after (below) the Crosstab Filter element. This is particularly relevant if your data returns some zero values, and you may want to experiment with this element in different locations in your definition.
The Crosstab Table Label Column element includes the Scope Row Header attribute. When set to True, the HTML output for data cells will be modified to improve Section 508 accessibility, creating a column which includes header information for each row, changing the <TD> tags to <TH Scope="Row"> tags.
A number of elements that are available for use with regular data tables, such as Header Row, Interactive Paging, and More Info Row, can also be used with crosstab tables. See our Data Table documentation for information about using these elements.