The Chart Canvas Child Elements
The Chart Canvas element also uses the following child elements to generate, control, and format the canvas and charts. Select the element link for more information.
| Element | Description |
|---|---|
| X-Axis and Y-Axis Elements |  Specifies properties of axis lines, grid lines, tick marks, and label fonts. Specifies properties of axis lines, grid lines, tick marks, and label fonts.
|
| Caption Style and SubCaption Style | |
| No Data Caption Style |  Specifies font-related properties for the No Data Caption. Specifies font-related properties for the No Data Caption.
|
| Crosstab Filter with Chart Canvas Charts | 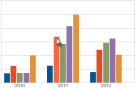 "Pivots" and groups the data for easier comparison. "Pivots" and groups the data for easier comparison.
|
| Input Selection | 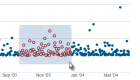 Provides the ability to select chart areas or points with the mouse. Provides the ability to select chart areas or points with the mouse.
|
| Legend | |
| The Resizer |  Adds "resizing handles"to the bottom and right sides of the canvas. Adds "resizing handles"to the bottom and right sides of the canvas.
|
| Trend Line | 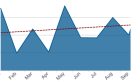 Generates a line on the chart indicating the "trend" of the data. Generates a line on the chart indicating the "trend" of the data.
|
| Zoom Control | 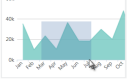 Allows the user to "zoom" into the canvas, magnifying a portion of it. Allows the user to "zoom" into the canvas, magnifying a portion of it.
|
| Series.Area | 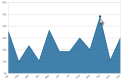 Adds this data visualization to the canvas. Adds this data visualization to the canvas.
|
| Series.Area Range | 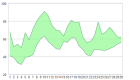 Adds this data visualization to the canvas. Adds this data visualization to the canvas.
|
| Series.Area Spline | 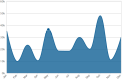 Adds this data visualization to the canvas. Adds this data visualization to the canvas.
|
| Series.Area Spline Range | 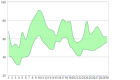 Adds this data visualization to the canvas. Adds this data visualization to the canvas.
|
| Series.Bar | 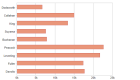 Adds this data visualization to the canvas. Adds this data visualization to the canvas.
|
| Series.Bar Range | 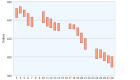 Adds this data visualization to the canvas. Adds this data visualization to the canvas.
|
| Series.Bubble | 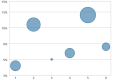 Adds this data visualization to the canvas. Adds this data visualization to the canvas.
|
| Series.Funnel | 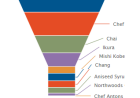 Adds this visualization to the canvas. Adds this visualization to the canvas.
|
| Series.Heatmap | 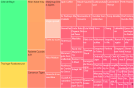 Adds this visualization to the canvas. Adds this visualization to the canvas.
|
| Series.Line | 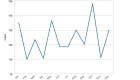 Adds this data visualization to the canvas. Adds this data visualization to the canvas.
|
| Series.Pie | 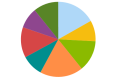 Adds this data visualization to the canvas. Adds this data visualization to the canvas.
|
| Series.Pyramid | 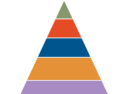 Adds this data visualization to the canvas. Adds this data visualization to the canvas.
|
| Series.Scatter | 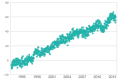 Adds this data visualization to the canvas. Adds this data visualization to the canvas.
|
| Series.Spline | 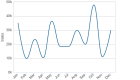 Adds this data visualization to the canvas. Adds this data visualization to the canvas.
|
| Series.Waterfall | 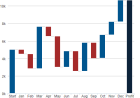 Adds this data visualization to the canvas. Adds this data visualization to the canvas.
|
| Series.Whiskers | 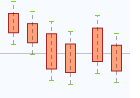 Adds this data visualization to the canvas. Adds this data visualization to the canvas.
|
 There is no "Series.Polar" element. To produce a Polar chart, set the Chart Canvas element's Polar attribute to True, which converts Cartesian series (Area, Line, Bar, etc.) to the Polar/Radial coordinate system.