Using the Chart Wizard
The fastest and easiest way to create a Chart Canvas chart is to use the Chart Wizard in Logi Studio. Here's how:
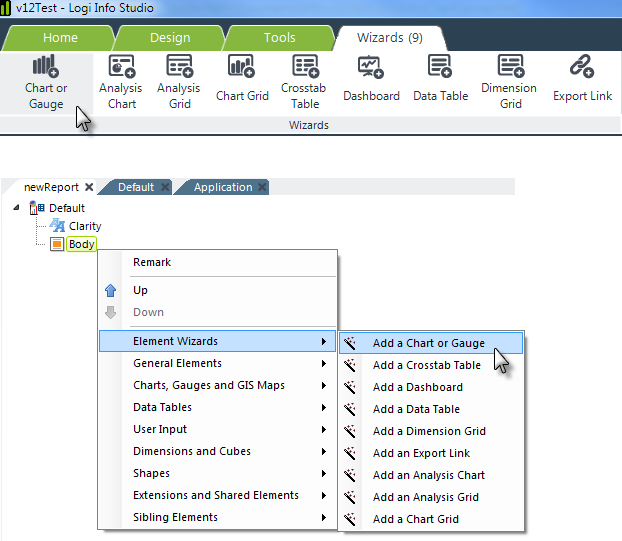
- As shown above, in a definition in Logi Studio, select an element like Body or a Division, and either click the Chart or Gauge item in the main menu's Wizards tab, or right-click the element and select Element Wizards, and then select Add a Chart or Gauge from the secondary menu.
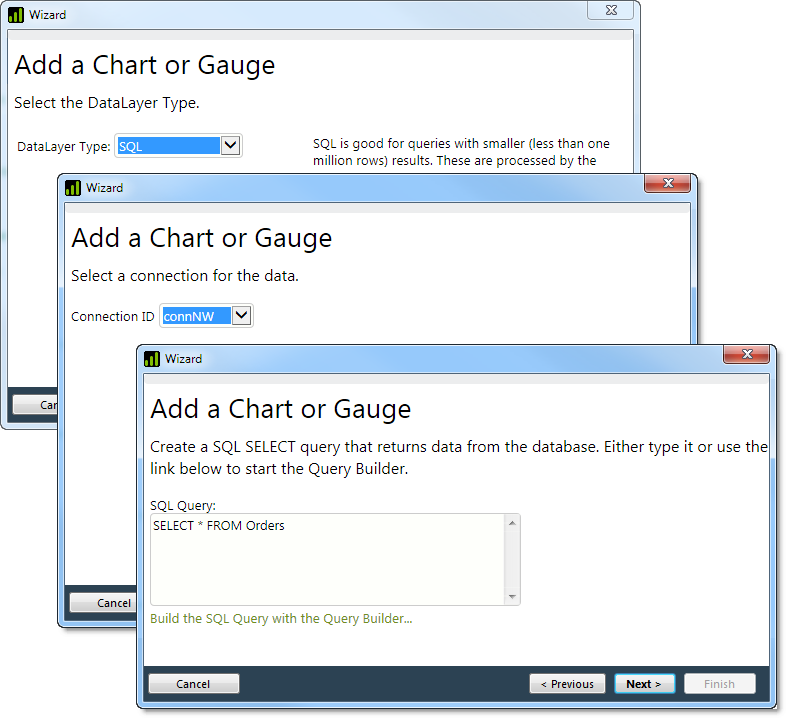
- A series of dialog boxes, shown above, will be displayed. These all relate to the retrieval of the data. Make appropriate selections for your application and click Next to move to the next dialog box. As you do, you'll see the wizard adding elements to your definition.
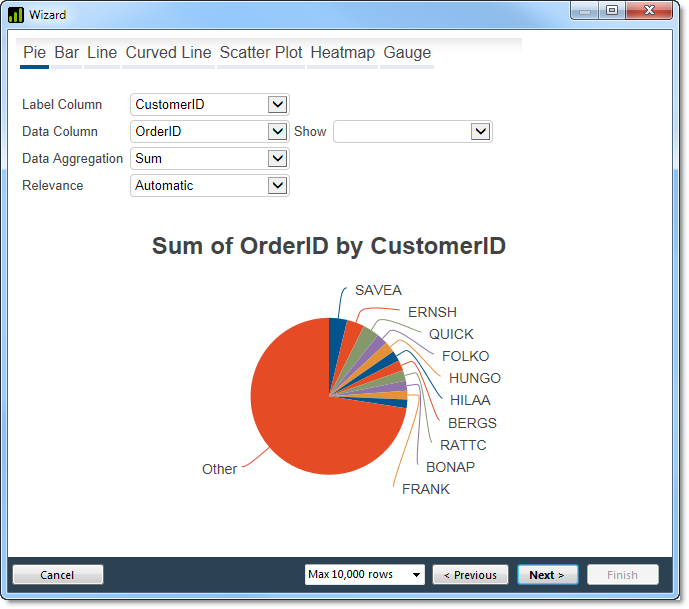
- Based on the data, the wizard will make an educated guess about appropriate chart types and will display a preview chart in the next dialog box. You can select other chart types from the options across the top, and select other data columns and analysis options. When the chart is just the way you want it, click Next.
The Max Rows option at the bottom of the dialog box controls the maximum number of rows that will be retained in the chart's datalayer.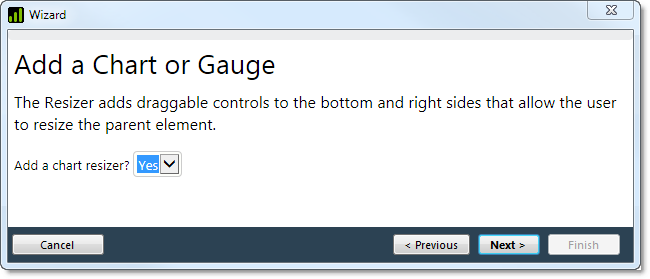
- Finally, you'll be asked if you want to add "resizer handles" to the chart. These allow the user to resize the chart at runtime by dragging the handles. Click Next to exit the wizard.
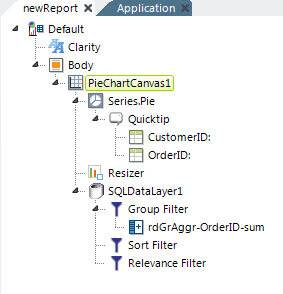
When you exit the wizard, it'll finish inserting all the configured elements for the chart into your report definition, as shown above. Preview your application and you should see your new chart.