X-Axis and Y-Axis Elements
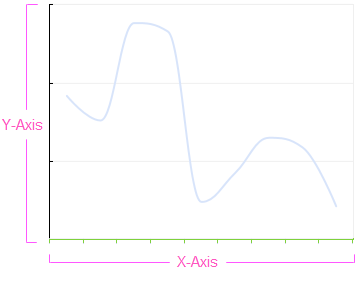
When the Chart Canvas element renders charts that use Cartesian coordinates, an X-axis and a Y-axis are drawn on the chart.
The following topics discuss how these axes can be configured:
- Axis Element Attributes
- Plotting Negative Values
- Styling the Axis Caption
- Styling the Axis Labels
- Adding a Marker Line
- Adding a Marker Band
- Configuring Major Ticks and Grid Lines
- Configuring Minor Ticks and Grid Lines
- Showing Totals for Stacked Series
- Adding Multiple Axes
About the Axis Elements
When a chart uses Cartesian coordinates, the X- and Y-axes provide the two references used by the eye to compare data values. Though they can be reversed, we generally think of the X-axis as the "label" and the Y-axis as the "data value".

You can think of them as an "overlay" on the canvas, providing the reference points over which the data values will be drawn. The X-Axis and Y-Axis elements are children of the Chart Canvas and can be used to control a variety of visual elements in the chart associated with the axes.
![]() A Chart Canvas element will draw an X- and Y-axis by default; the X-Axis and Y-Axis elements are only needed if you want to customize the axis.
A Chart Canvas element will draw an X- and Y-axis by default; the X-Axis and Y-Axis elements are only needed if you want to customize the axis.