Series.Whiskers
The Chart Canvas element's Series child elements cause a data visualization (the chart) to be rendered in the canvas.
The following topics discuss the Series.Whiskers child element:
- Series.Whiskers Attributes
- Using the Quicktips Element
- Using Action Elements
- Using the Refresh Series Timer
About Series.Whiskers
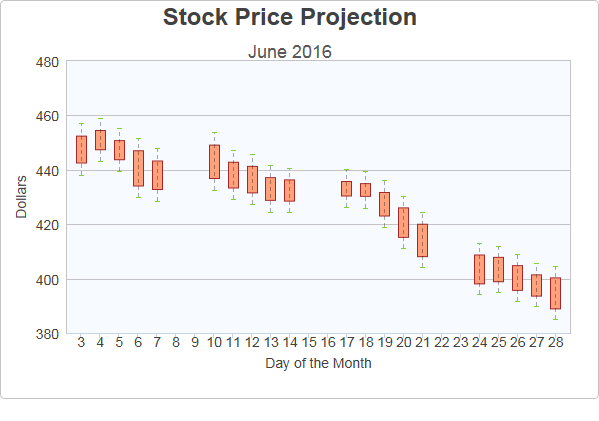
The Series.Whiskers elementgenerates graphics which, when used with other Series (usually Series.Bar Range), represents the variability of the data. It's most often used to indicate the uncertainty or the "margin of error" in the data.

The example above shows a Bar Range chart, representing projected stock prices for a month, with "whiskers" showing the margin of error in the projections.

As shown above, the chart is created by adding Series.Bar Range and Series.Whiskers to the canvas, along with a datalayer and, typically, some datalayer child elements that may include a Group Filter, and a Group Aggregate Column element. Very few attributes need to be set for the Series element in order to produce a basic chart.
![]() A datalayer element must be used beneath the Chart Canvas element because, unlike other Series elements, Series.Whiskers cannot have its own child datalayer. Both series will then use this datalayer.
A datalayer element must be used beneath the Chart Canvas element because, unlike other Series elements, Series.Whiskers cannot have its own child datalayer. Both series will then use this datalayer.