Work with Logi XOLAP
Logi XOLAP (pronounced "zo lap") is a new technology that brings the analytical power of data cubes to your relational data and other diverse data sources such as web services, XML, and files. This topic describes the use of the elements associated with Logi XOLAP.
- Overview
- The Dimension Grid Element
- Dimension Grid Settings Panels
- Configure the Data Cube
- DataLayer.Xolap Query
- Logi XOLAP on the Debugger Page
- Add XOLAP Grid Visualizations to Dashboards
- Refresh, Reset, and Save Grid Settings
XOLAP is not available in Logi Report.
Overview
If you have not done so already, see Logi XOLAP for important basic information before proceeding here.
The two major parts of the Logi XOLAP technology are the Dimension Grid element, which is the user interface into the data, and its child element, the Xolap Cube, which retrieves the data, constructs the data cube, and connects it to the Dimension Grid. The Xolap Cube uses a number of child elements, including one or more datalayers, to retrieve the desired data.
The Dimension Grid is a "super-element", similar to the Analysis Grid and the OLAP Grid elements. At runtime, users can manipulate the data they see and the way in which it's presented using the Dimension Grid's user interface controls. The report developer has complete control over which controls are available to a user and can present them selectively to different users.
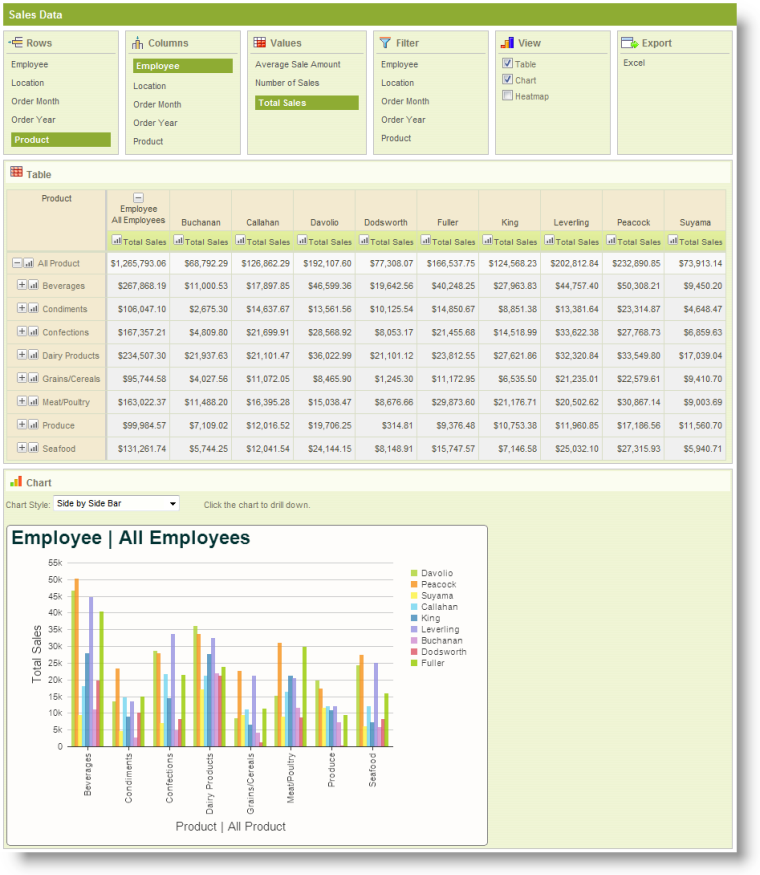
The example above shows a Dimension Grid configured to show two of its option panels and set to include a Line Chart. The data table behaves like a crosstab table, and can pivot data.
The Dimension Grid settings selected by a user can be saved at the end of their session and restored during a later session.
Dimension Grid charts include a number of versatile features:

An automatic tooltip is displayed, as shown above, when the mouse of hovered over a chart segment and the chart can be resized dynamically, by dragging the resizer handles (circled above), which appear when the mouse is hovered over them.
In addition, you can drill-down into the data by clicking on chart segments. When you do, the chart will redraw itself at the new level of detail.
![]() Chart Canvas charts, introduced in v11.2.040, are used by default by the Dimension Grid, in all new applications started in v11.2.040 and later. Older Logi applications that are upgraded to v11.2.040+ will use the classic static charts for their Dimension Grids. To force upgraded apps to use Chart Canvas charts, add the constant rdFavorChartCanvas
= True
to your _Settings definition.
Chart Canvas charts, introduced in v11.2.040, are used by default by the Dimension Grid, in all new applications started in v11.2.040 and later. Older Logi applications that are upgraded to v11.2.040+ will use the classic static charts for their Dimension Grids. To force upgraded apps to use Chart Canvas charts, add the constant rdFavorChartCanvas
= True
to your _Settings definition.
In v10.1.59, the Dimension Grid Group Drillthrough child element was added. It enables drill-through on cell values and adds a drill-through link in each cell. When the drill-through icon is clicked, a new report page containing a basic data table is displayed. The table lists the drill-through rows with all the columns used to build the cube. The element's Caption attribute sets the title of the drill-through report page
Logi Studio contains a Dimension Grid wizard that will create all of the elements necessary to work with Logi XOLAP. For information about this wizard, see Dimension Grid Wizard.
The Dimension Grid Element
The Dimension Grid element is the parent element of all other Xolap family elements. Its special attributes are:
| Attribute | Description |
|---|---|
ID | (Required) A unique element ID. |
| Caption | Specifies a title that will appear in the bar above the control panels. |
| Chart Hover Highlighting | Enables Hover Highlighting, which causes chart features such as bars and lines to be highlighted when the mouse pointer is hovered over them. Default value: True. (Introduced in v11) |
| Level Indent | Specifies the amount of indentation spaces used when showing levels of a hierarchy on the left side of the Dimension Grid. Default value: 2 |
| Saved Dimension Grid Folder | The Dimension Grid settings made by a user at run time may be saved by using the Procedure.Save Dimension Grid element in a process task. The settings can later be reloaded by passing the saved setting filename in the rdDgLoadSaved parameter. The value of this attribute (Saved Dimension Grid Folder) sets the name of the folder that contains the saved files. |
| Security Right ID | The ID of a Right defined in the application's _Settings/Security section when using Logi Security; controls who can see and use the Dimension Grid element. |
| Template Modifier File | The name of a custom template file that can be used to change language- and culture-specific Caption attributes in the grid. |
Dimension Grid Settings Panels
The Dimension Grid Panel elements determine what data and which options are available to the user at runtime. Let's examine the panels:
| Panel | Description |
|---|---|
| Links in this panel allow the user to select the data that will populate each row in the data table. The links are the names of dimensions in the cube, which represent specific columns in the datalayer. The data for the selected dimension will appear in the left-most column of the data table. They're added to the report definition using Xolap Dimension elements. Link selection is mutually-exclusive: clicking one link cancels a previously selected link. |
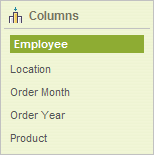 | Links in this panel allow the user to select the data that will populate each column in the data table. The links are the names of dimensions in the cube, which represent specific columns in the datalayer. The data for the selected dimension will appear in the top-most row of the data table, as column headers. They're added to the report definition using Xolap Dimension elements. Link selection is mutually-exclusive: clicking one link cancels a previously selected link. |
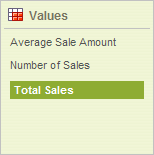 | Links in this panel allow the user to select the data values that will appear in the cells that are the intersections of rows and columns. The links are the names of measures, which are aggregations, calculations, and summarizations of the data in the datalayer. They're added to the report definition using Xolap Measure elements. Link selection is not mutually-exclusive: multiple links can be selected at once and clicking a selected link "unselects" it. |
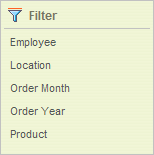 | Links in this panel allow the user to set one or more filters that exclude some or all of the data values for all dimensions. Filter links are automatically created for each dimension. When a link is selected, a popup panel displays the values and checkboxes; unchecking a box removes that data from the grid.. Link selection is not mutually-exclusive: multiple filters can be used at once. When a filter has been imposed, the link is shown in bold as an indication that filtering is being used. |
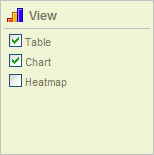 | Checkboxes in the panel determine which data visualizations (table, chart, and heatmap) will be displayed. In v10.1.59, the Dimension Grid was changed to use the Chart.Heatmap instead of the Heatmap applet. |
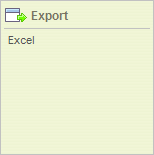 | The Excel link in this panel exports the table data to Excel. Charts and heatmaps, even if displayed, are not exported. |
Table, charts, and heatmaps are themselves also Dimension Grid Panel elements and, along with all the rest, can be selectively shown or hidden by the report developer.
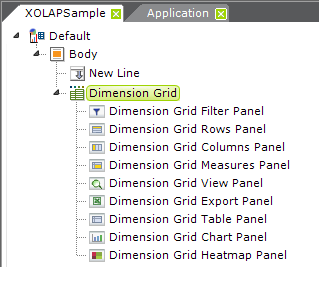
The report definition for the Dimension Grid shown earlier, with all its panel elements, looks like the example above. Note that, regardless of the arrangement of the elements, the panels will always be displayed in the browser in the vertical arrangement shown earlier. So, for example, you can't make the Rows and Columns panels appear below the data table.
Dimension Grid Panel elements are not required. By default, if you leave them out, all panels will be displayed. To hide a panel, include its grid panel element and set its Show Panel attribute to False. This value can also be set using @Request and @Session tokens.
The table, chart, and heatmap panels include attribute values for initially setting them as visible or hidden, and the chart panel includes an additional Color attribute that lets you select a custom color set for the charts.
One interesting possible "use case" is to show only the chart and not the table, heatmap, or any other panels. Drill-down into the data would still be available through the chart and this might be a useful configuration, for example, in a dashboard.
Configure the Data Cube
In order to create the data cube, we need to use a datalayer to retrieve the data and several Xolap-family elements to define the aspects of the cube related to that data.
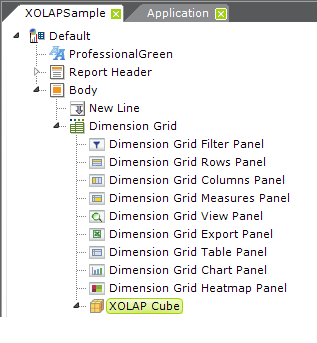
As shown above, the Xolap Cube element is added to a definition as a child of the Dimension Grid.
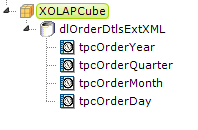
Next, a datalayer appropriate to our data source is added to retrieve the data. As shown above, any of the usual datalayer child elements (in this case, Time Period Columns) can be added as well, to shape the data as desired.
The actual Source attribute value for the DataLayer.SQL element in this example is:
SELECT [Order Details Extended].UnitPrice, [Order Details Extended].Quantity,
[Order Details Extended].ExtendedPrice, Categories.CategoryName,
Products.ProductName, Orders.OrderDate, Customers.CompanyName,
Customers.Country, Customers.Region, Customers.City, Employees.LastName, Employees.FirstName
FROM [Order Details Extended] INNER JOIN
Orders ON [Order Details Extended].OrderID = Orders.OrderID INNER JOIN
Products ON [Order Details Extended].ProductID = Products.ProductID INNER JOIN
Categories ON Categories.CategoryID = Products.CategoryID INNER JOIN
Customers ON Customers.CustomerID = Orders.CustomerID INNER JOIN
Employees ON Employees.EmployeeID = Orders.EmployeeID
Given that we're analyzing the data from a number of tables, the large number of joins is typical of Dimension Grid queries.
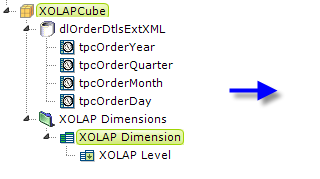

Now we add, as shown above, a Xolap Dimensions element and, beneath it, a Xolap Dimension element. The former is just a container, without any attributes, and can have many Xolap Dimension children. The latter provides a way to "slice" data in the Dimension Grid. There can be multiple dimension child elements, and each contains one or more Xolap Level elements, enabling the creation of a general-to-specific hierarchy of data. For example, a single-level dimension could be based on a data field indicating the marital status of a customer, while a multi-level dimension could reflect the location of a customer, with levels for country, state, city, and street address.
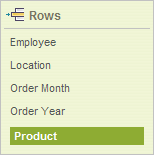 The Dimension Name attribute value appears as a link in the Dimension Grid's Rows, Columns, and Filters settings panels. Dimensions
automatically have an "All" category at the highest level. Defining cube levels
enables drilling down into the dimension.
A Xolap Level element attributes identify the data column which contains the value at a dimension level.
Sort Dimensions by Dates
Dates in dimension values are sorted as strings, which can be confusing. To make a date-type dimension appear in sorted order across the Dimension Grid, ensure that its data is returned into the datalayer as a DateTime value in ISO format (yyyy-mm-dd). To sort the dimension by month and display the month number, set its Xolap Level element's Format attribute to MM. To sort it by year and display the year number instead, set this attribute to yyyy.
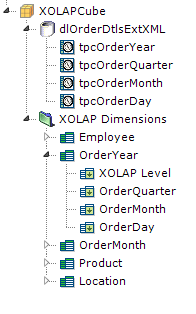
The example above shows the definition after additional dimensions and levels have been added. Look at the image of the Rows panel above and you'll see how the Xolap Dimension names equate to the links in the panels.
In v10.0.117, the Xolap Member Property element was introduced. A "member property" is an additional data field that can be displayed alongside a
dimension level on the left axis. It does not have to be related
to the dimension of the level to which it belongs. For example, a member
property for "City Population" data could be defined on the City level of the Customers
dimension, between levels for State and Address. The City Population
will then be available for display whenever the City level of the Customers
dimension is visible on the left axis.
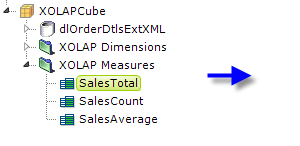
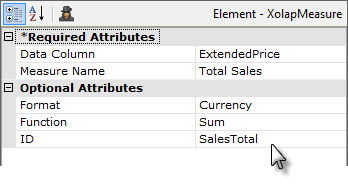
In the example shown above, the datalayer and dimensions are collapsed for reading clarity. Then a Xolap Measures element is added, with child Xolap Measure elements beneath it. The Xolap Measure element specifies a numeric data-type field that can be displayed in the
grid. Data values are aggregated based on the
Function attribute, and the aggregate value can be formatted using the Format attribute.

In v10.2.314, the Xolap Calculated Measure element (not shown) was introduced. It allows you to create measures that use formulae that reference other measures. A new token, @Measure, was
also introduced to allow you to reference the values of other measures in those formulae.
The Measure Name attribute for these elements is picked up and shown as a link in the Dimension Grid's Values settings panel.
And, with that, we have everything we need for a functional Dimension Grid.
DataLayer.Xolap Query
If you were to run the example XOLAP definition shown above you would notice that, while we define all the dimensions and measures, when the Dimension Grid is first displayed, no data is actually shown.
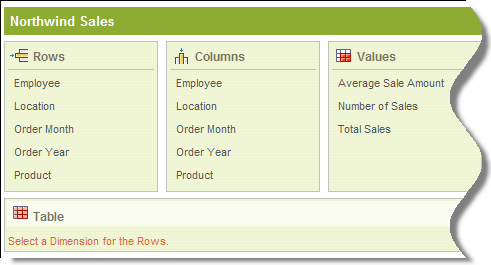
The example shown above is what the user first sees: no data and an instruction to selection a Dimension. However, what if you want the definition to show data right away?
Logi XOLAP technology introduces a new member of the datalayer family, DataLayer.Xolap Query, for this purpose. This element, and its related child elements, allows you to retrieve the data, identify dimensions and measures, and present the user with visible data when the report runs.
Logi XOLAP on the Debugger Page
The Debugger Trace Page that appears when debugging is turned on contains very useful information when Logi XOLAP is used. For more information, see Debug Reports.
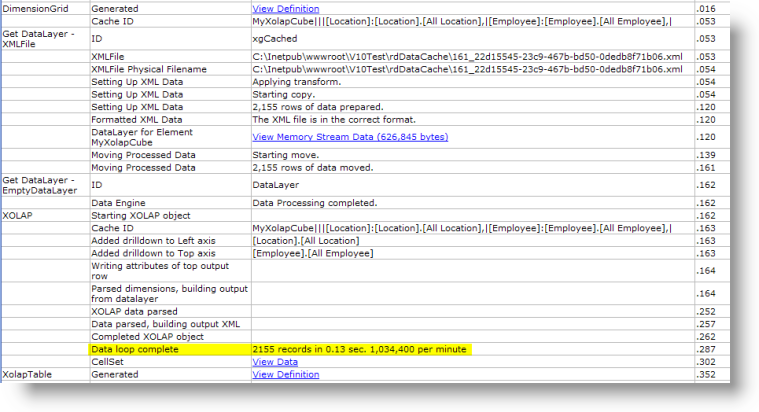
As shown in the example above, the Debugger Trace Page includes the details of Logi XOLAP processing. It also includes the total elapsed processing time in seconds, and an extension of that time in minutes, shown highlighted in yellow. This can be useful in understanding and possibly tweaking performance, and is especially helpful when using DataLayer.Xolap Query.
Add Dimension Grid Visualizations to Dashboards
An exciting new level of interaction between the Dimension Grid and the Dashboard element was introduced in v11.1.033. Users working with an Dimension Grid in one report, at runtime, can generate a table or chart and then, with one mouse click, add it as a new panel in an existing Dashboard in another report.
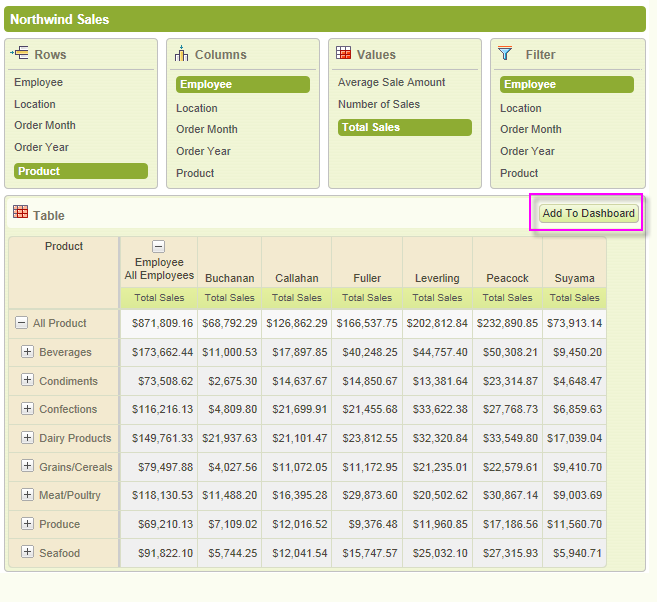
When properly configured, Dimension Grid tables and charts will display an Add To Dashboard button, as shown above.
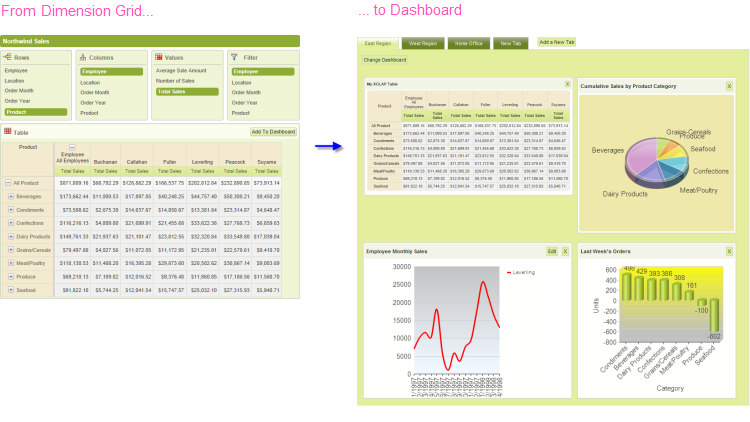
When the button is clicked, the table or chart is added as a new panel in the Dashboard, as shown above. When the resizing control is used to resize a chart, the widths of the dashboard columns and other panels will adjust dynamically.
Behind the scenes, when the button is clicked, the Dimension Grid writes the underlying XML for its chart into the Dashboard's configuration file (its "Save File"). In the Dashboard, the chart is inserted at the top of Column 1; if Dashboard tabs are being used, the insertion occurs in the currently active tab.
Just before panel insertion, the user will be prompted for the Panel Title and a description for display on the Configuration Page.
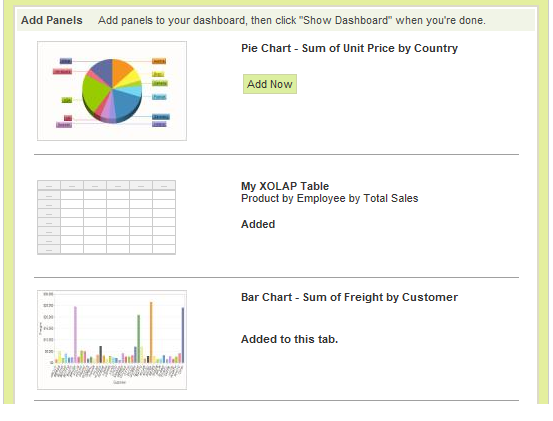
The new chart panel thereafter appears in the Dashboard Configuration Page, as shown above, just like any other panel, complete with a thumbnail image. The new panel can be removed from the visible dashboard panels and from the configuration page entirely, using the usual controls.
The user can insert multiple tables and charts into a Dashboard using this technique.
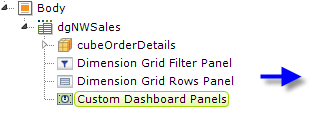
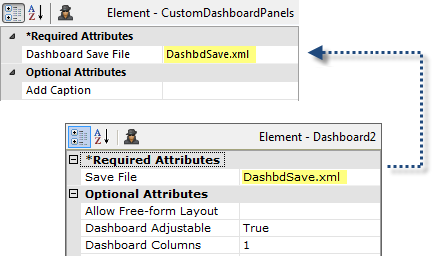
In the report definition, the developer makes this functionality available by adding a Custom Dashboard Panels element, shown above, beneath an Dimension Grid element. Its Dashboard Save File attribute value should be set to match the target dashboard's Save File attribute value.
![]() The Save File attribute values shown above have been shortened for visual clarity. However, a fully-qualified path and file name, with .xml extension, is required, so a realistic attribute value would be something like:
The Save File attribute values shown above have been shortened for visual clarity. However, a fully-qualified path and file name, with .xml extension, is required, so a realistic attribute value would be something like:
@Function.AppPhysicalPath~\DashFiles\DashbdSave.xml
and the account the Logi application runs under (in Windows, ASPNET or NETWORK SERVICE) would be given Write permissions to the "DashFiles" folder. For experimentation purposes, you can use the rdDownload folder, for which appropriate permissions already exist (but its contents are periodically deleted, so don't use it for anything but experimentation).
Dashboard Save Files are often named using a token, such as @Function.UserName~, in order to create personalized dashboard configurations and, in that case, the Custom Dashboard Panel attribute would use the same token.
![]() The Custom Dashboard Panels element has a new attribute, Add Caption, which sets the caption for the button used to save the data table or chart. If left blank, the caption is "Add to Dashboard".
The Custom Dashboard Panels element has a new attribute, Add Caption, which sets the caption for the button used to save the data table or chart. If left blank, the caption is "Add to Dashboard".
For more information about Dashboards, see Introduction to the Dashboard.
Refresh, Reset, and Save Grid Settings
There are several possible actions that require links outside of the grid which you might want to make available to Dimension Grid users:
For This Action | Do This |
| Refresh | To refresh the data in the grid, without affecting any other settings, call the report definition recursively and include this Link Param: rdDgRefreshData = True The parameter name is case-sensitive. |
Reset | To clear all user settings and restore the grid to its default state, call the report definition recursively and include this Link Param: rdDgReset = True The parameter name is case-sensitive. |
| Save Settings | To save all user settings for future sessions, use an Action.Process element to call a process task. In the task use a Procedure.Save Dimension Grid element to save the settings. The file name itself can incorporate a login name, a GUID, or another method of making it unique to the user, and can be preserved in a number of ways, including as a Cookie on the user's machine. |
| Restore Settings | Once settings have been saved, they can be restored by calling the report and passing the Link Param: rdDgLoadSaved = <filename> Once again, the parameter name is case-sensitive. You can use this method to provide a "default" grid configuration for your users: configure the grid, save its settings, distribute the saved settings file with the report, and call the report with the rdDgLoadSaved parameter in the URL. |
The following XML source code example demonstrates the use of these special parameters:
<Division ID="divControlMenu">
<LineBreak LineCount="2" />
<Label Caption="Reset" ID="lblReset">
<Action Type="Report"
ID="actRestart">
<Target
Type="Report" ID="tgtRestart" />
<LinkParams rdDgReset="True" />
</Action>
</Label>
<Label Caption=" | " ID="bar"
/>
<Label Caption="Refresh Data"
ID="lblRefreshData">
<Action Type="Report"
ID="actRefreshData">
<Target
Type="Report" ID="tgtRefresData" />
<LinkParams rdDgRefreshData="True" />
</Action>
</Label>
<Label Caption=" | " ID="bar"
/>
<Label Caption="Save"
ID="lblSave">
<Action Type="Process"
Process="MyTasks" ConfirmMessage="Save the Grid?" TaskID="SaveDG" ID="actSave"/>
</Label>
<Label Caption=" | " ID="bar"
/>
<Label Caption="Restore"
ID="lblRestore">
<Action Type="Report">
<Target Type="Report"
/>
<LinkParams
rdDgLoadSaved="@Cookie.DgFilename~" />
</Action>
</Label>
<LineBreak LineCount="2" />
</Division>
When saving the grid settings in a Process task, using the Procedure.SaveDimensionGrid element, you need to provide a fully-qualified file path and file name (including an .xml file extension) in the Filename attribute. For example:
C:\inetpub\wwwroot\SampleDimensionGrid\SavedGridData\mySettings.xml
The @Function.AppPhysicalPath~ token may be useful here.
However, when restoring saved settings, two separate values are used so that you do not have to expose the file path in your query string:
- Set the Dimension Grid element's Saved Dimension Grid Folder attribute to the fully-qualified file path for the folder that contains the stored settings file. For example: C:\inetpub\wwwroot\SampleDimensionGrid\SavedGridData. The @Function.AppPhysicalPath~ token may be useful here.
- In the Process task that restores the saved settings, call the report definition that contains the Dimension Grid and pass the link parameter rdDgLoadSaved mentioned earlier, and set its value to the filename, with .xml extension, only. Do not include any path information here. For example: mySettings.xml
The Dimension Grid will automatically combine the attribute value and the request variable to obtain the fully-qualified path and filename for the saved settings file.