Dimension Grid Wizard
Logi Info includes a new technology called Logi XOLAP (pronounced "zo lap") that brings the analytical power of data cubes to your relational data and other diverse data sources such as web services, XML, and files. This topic describes the Dimension Grid Wizard in Logi Studio, which can be used to build Logi XOLAP data cubes.
- About Logi XOLAP
- Prepare
- Use the Wizard
- Sort Dimensions by Dates
XOLAP is not available in Logi Report.
About Logi XOLAP
If you have not done so already, see Logi XOLAP for important basic information before proceeding here.
The two major parts of the Logi XOLAP technology are the Dimension Grid element, which is the user interface into the data, and its child element, the Xolap Cube, which retrieves the data, constructs the data cube, and connects it to the Dimension Grid. The Xolap Cube uses a number of child elements, including one or more datalayers, to retrieve the desired data.
The Dimension Grid is a "super-element", similar to the Analysis Grid and the OLAP Grid elements. At runtime, users can manipulate the data they see and the way in which it's presented using the Dimension Grid's user interface controls. The report developer has complete control over which controls are available to a user and can present them selectively to different users.
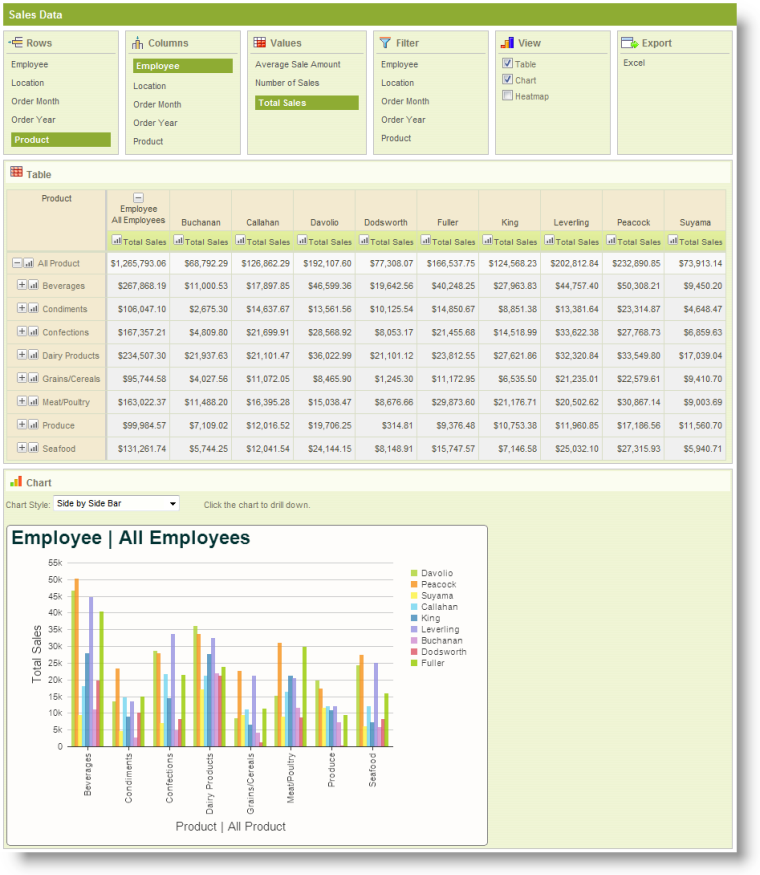
The example above shows a Dimension Grid configured to show a data table and a bar chart. The data table behaves like a crosstab table, and can pivot data.
This topic discusses the Logi Info Studio Dimension GridWizard that will create all of the elements necessary to work with Logi XOLAP. If you are interested instead in information about building cubes manually, using individual elements, see Work with Logi XOLAP.
The Dimension Grid wizard incorporates several other wizards which help you create Xolap Cubes, Xolap Dimensions, and Xolap Measures. Each of these wizards can be run individually from their context menu or the Element Toolbox when they're selected.
Preparing
Prior to running the Dimension Grid wizard:
- Become familiar with the data you'll be working with. Identify the data columns that will become dimensions and measures, what values (aggregations) you need, and how you might want to filter the data.
- Ensure that you have a valid Connection configured in _settings and can connect to your datasource.
- If you're using a SQL data source, you may care to experiment a bit in the Query Builder to develop the query that you'll need.
- You should also keep an eye on the number of result rows your query is likely to return. While Logi XOLAP can process 10s of thousands of data rows into an XML cube very quickly, millions of result rows may produce unacceptable delays.
Now, launch Studio and open your report definition.
Using the Wizard
The following examples walk you through using the Dimension Grid wizard.
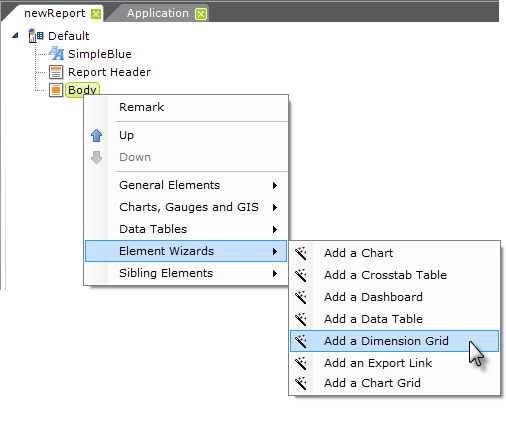
- Start the wizard by right-clicking the grid's parent and selecting Element Wizards
 Add a Dimension Grid, as shown above.
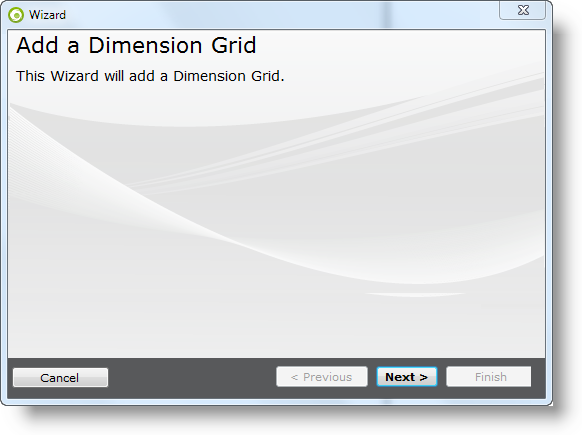
- Add a Dimension Grid Wizard - Click Next to start the wizard.
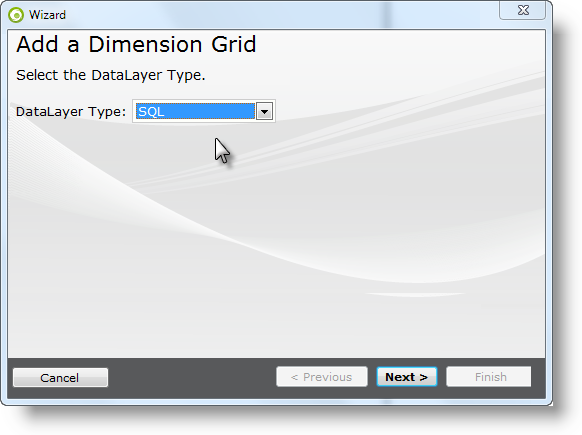
- Datalayer Type - Select the appropriate datalayer type for your datasource. Click Next.
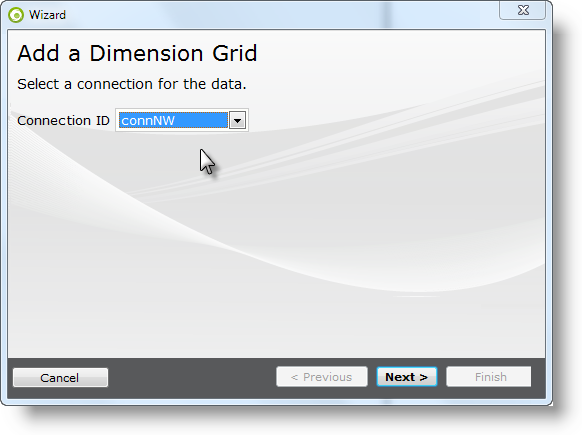
- Connection ID - Select the desired connection from the list of connections defined in the _Settings definition. Click Next.
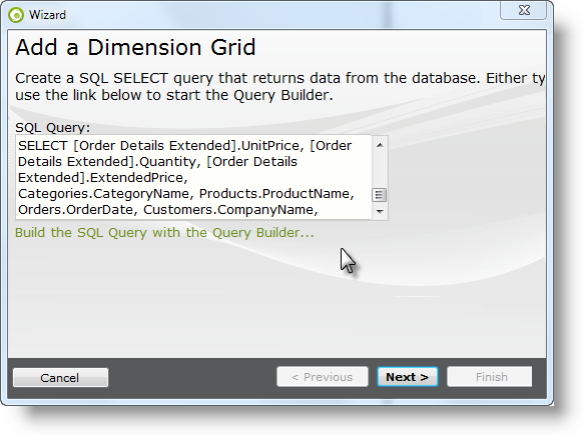
- SQL Query - If you 're using a SQL datasource, enter the query (or use the query wizard to build one) and click Next. This example uses the following T-SQL query:
SELECT [Order Details Extended].UnitPrice, [Order Details Extended].Quantity, [Order Details Extended].ExtendedPrice, Categories.CategoryName, Products.ProductName, Orders.OrderDate, Customers.CompanyName, Customers.Country, Customers.Region, Customers.City, Employees.LastName, Employees.FirstName
FROM [Order Details Extended]
INNER JOIN Orders ON [Order Details Extended].OrderID = Orders.OrderID
INNER JOIN Products ON [Order Details Extended].ProductID = Products.ProductID
INNER JOIN Categories ON Categories.CategoryID = Products.CategoryID
INNER JOIN Customers ON Customers.CustomerID = Orders.CustomerID
INNER JOIN Employees ON Employees.EmployeeID = Orders.EmployeeID
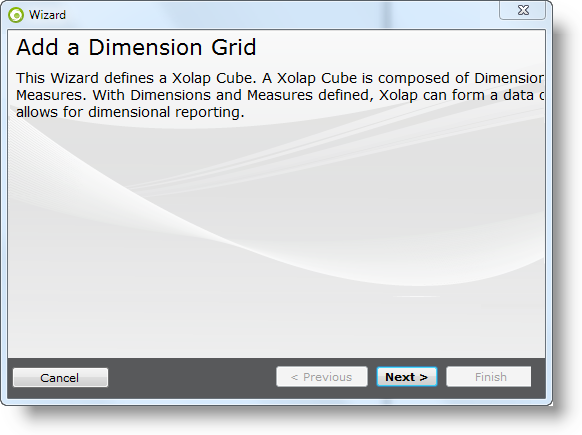
- Xolap Cube Wizard - Click Next to start the cube wizard.
- Create Dimensions - Add dimensions by entering the arbitrary Dimension Name in the text box and clicking Add.
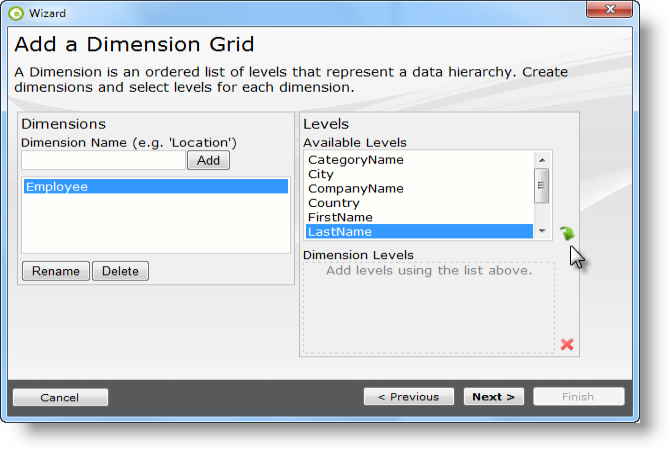
- Add Levels - Select a data column for a hierarchical level from the list and click the green arrow.
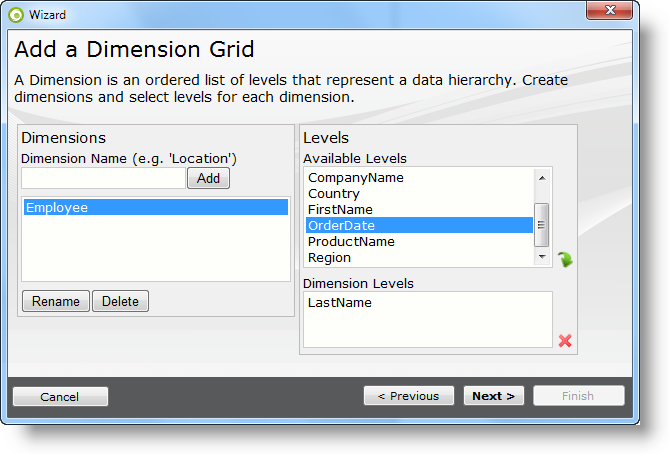
The column you selected will be added to the lower list of Dimension Levels. Repeat to add as many levels as desired. To remove a level, select it and click the red X. See the Sorting Dimensions by Date section if you're creating levels using datetime-type columns.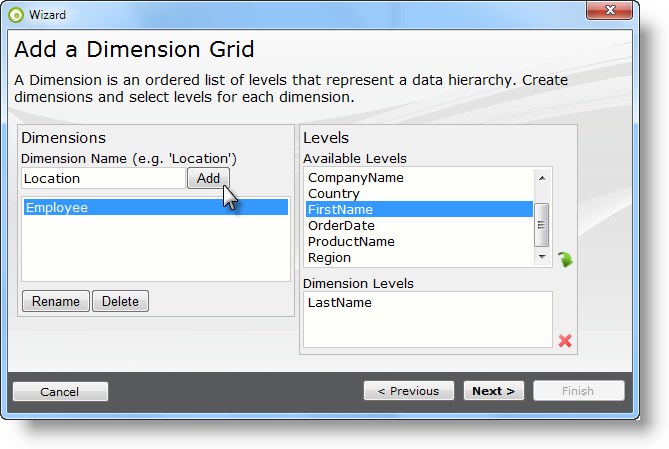
- Add More Dimensions and Levels - Repeat the process of adding dimensions and levels until all dimensions have been configured. Use the Rename and Delete buttons to affect dimensions you've already configured.
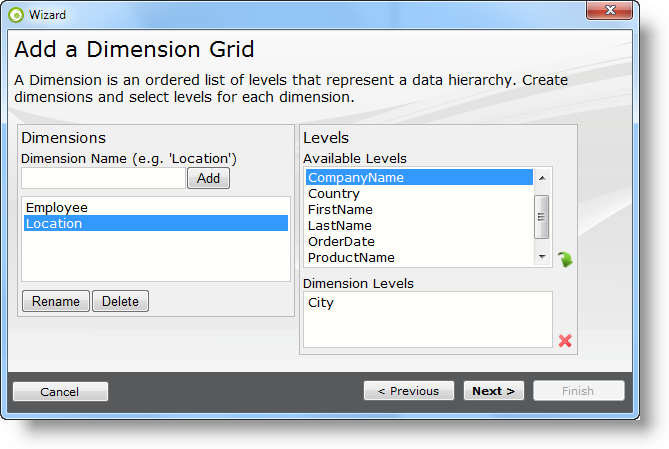
When all dimensions and levels have been configured, click Next.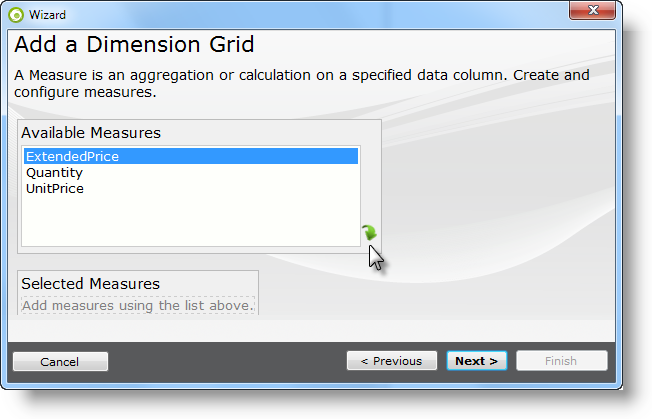
- Create Measures - Select a data column to be aggregated from the list and click the green arrow.
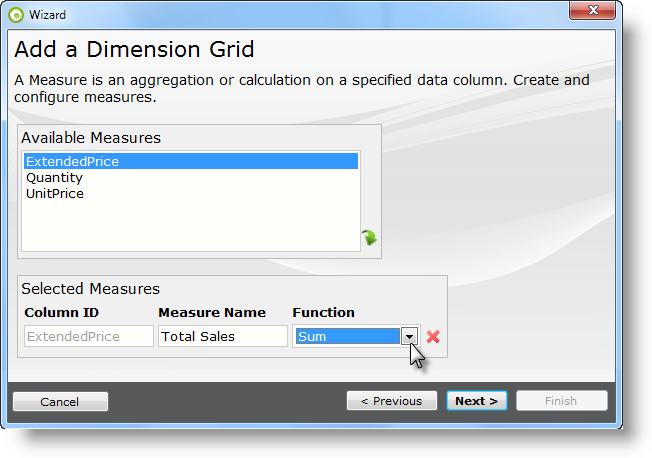
The selected measure will appear below. Enter an arbitrary Measure Name and select the aggregation or summarization function to be applied to it. To remove a measure, click the adjacent red X.
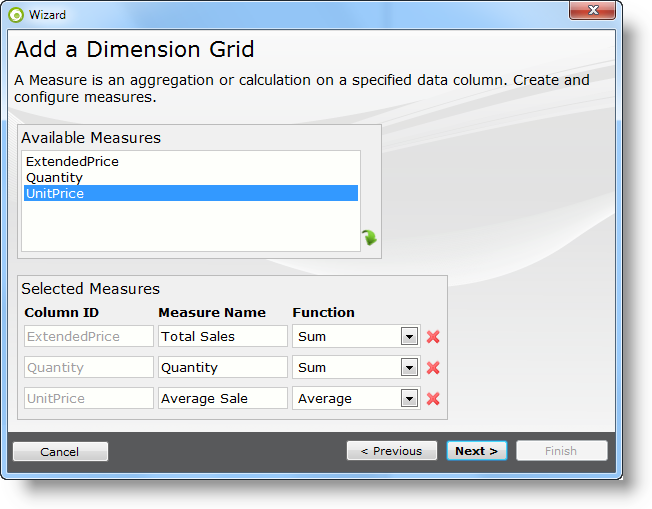
- Add More Measures - Repeat the process until all measures have been configured, then click Next.
- Done - Click Finish to close the wizard.
The wizard adds all the appropriate elements to your report definition. Save the definition and run it.
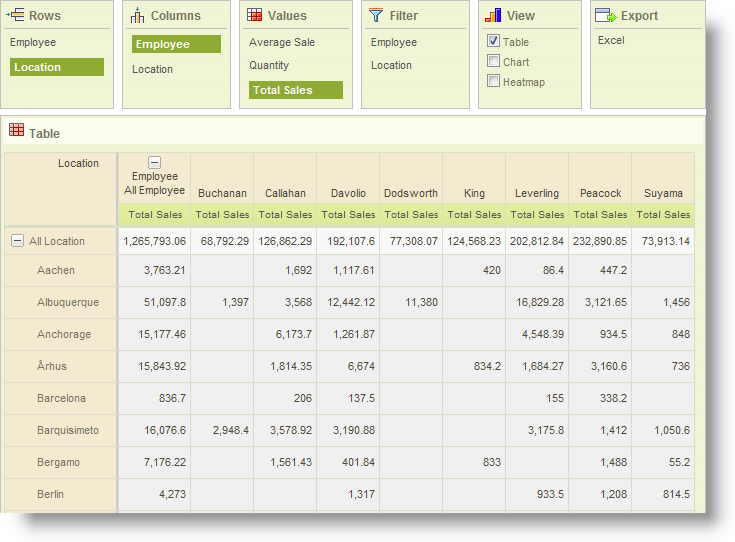
When it appears, select dimensions, measures, and values from the Dimension Grid and view your data.
Sorting Dimensions by Dates
Dates in dimension values are sorted as strings, which can be confusing. To make a date-type dimension appear in sorted order across the Dimension Grid, ensure that its data is returned into the datalayer as a datetime value in ISO format (yyyy-mm-dd). To sort the dimension by month and display the month number, you will need to manually set its Xolap Level element's Format attribute to MM once the wizard is finished. To sort it by year and display the year number instead, set this attribute to yyyy.