Dimension Grid
The Dimension Grid is a "super-element", similar to the Analysis Grid and the OLAP Grid elements, used with Logi XOLAP data cubes.
The following topics describe the Dimension Grid and related elements:
- Dimension Grid Attributes
- Dimension Grid Settings Panels
- Configuring the Data Cube
- Defining an Initial View
- Logi XOLAP on the Debugger Page
- Adding Visualizations to Dashboards
- Refresh, Reset, and Save Grid Settings
- Customizing Dimension Grid Appearance
![]() Logi XOLAP has been deprecated; the related elements are still supported, for now, and will work but they're no longer available in Logi Studio
Logi XOLAP has been deprecated; the related elements are still supported, for now, and will work but they're no longer available in Logi Studio
About the Dimension Grid
If you have not done so already, see Logi XOLAP for important basic information before proceeding here.
The two major parts of the Logi XOLAP technology are the Dimension Grid element, which is the user interface into the data, and its child element, the XOLAP Cube, which retrieves the data, constructs the data cube, and connects it to the Dimension Grid. The XOLAP Cube uses a number of child elements, including one or more datalayers, to retrieve the desired data.
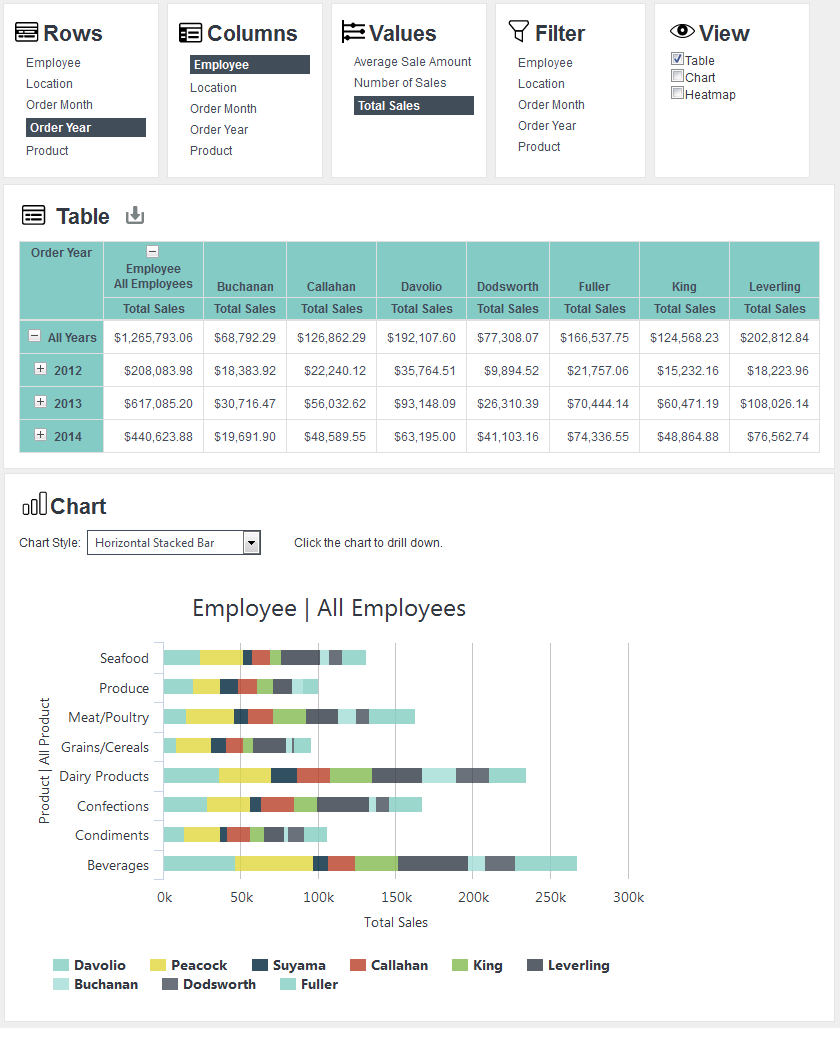
At runtime, Dimension Grid users can manipulate the data they see and the way in which it's presented using the Dimension Grid's built-in user interface controls. The report developer has complete control over which controls are available to a user and can present them selectively to different users.

The example above shows a Dimension Grid configured to show two of its option panels and set to include a Bar chart. The data table behaves like a crosstab table, and can pivot data.
The Dimension Grid settings configured by a user can be saved at the end of their session and restored during a later session.
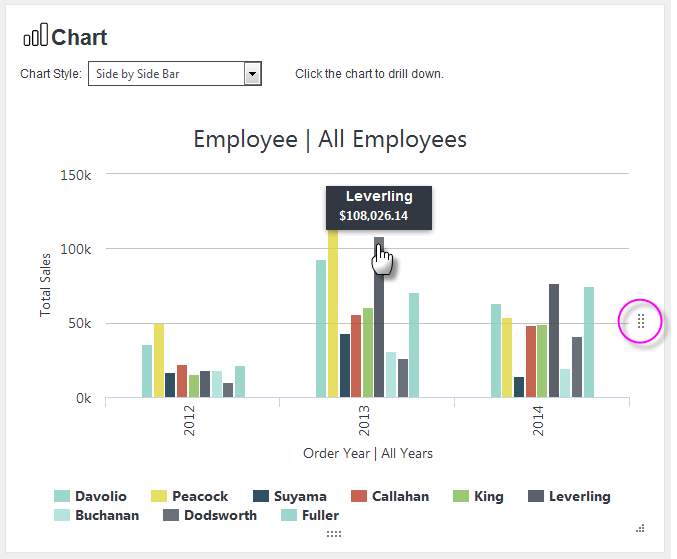
Dimension Grid charts include a number of versatile features:

An automatic tooltip is displayed, as shown above, when the mouse cursor is hovered over a chart segment. The chart can be resized dynamically, by dragging the resizer handles (circled above), which appear when the mouse cursor is hovered over the chart.
In addition, you can drill-down into the data by clicking on chart segments. When you do, the chart will redraw itself at the new level of detail. Click the appropriate chart icon in the data table to return to the previous data level.
![]() Chart Canvas charts are used by default by the Dimension Grid, in all new applications. Older Logi applications that are upgraded to v12 will use the Classic static charts for their Dimension Grids by default. To force upgraded apps to use Chart Canvas charts, add the constant rdFavorChartCanvas
= True
to your _Settings definition.
Chart Canvas charts are used by default by the Dimension Grid, in all new applications. Older Logi applications that are upgraded to v12 will use the Classic static charts for their Dimension Grids by default. To force upgraded apps to use Chart Canvas charts, add the constant rdFavorChartCanvas
= True
to your _Settings definition.
The Dimension Grid Group Drillthrough child element enables drill-through on cell values and adds a drill-through link in each cell. When the drill-through icon is clicked, a new report page containing a basic data table is displayed. The table lists the drill-through rows with all the columns used to build the cube. The element's Caption attribute sets the title of the drill-through report page.

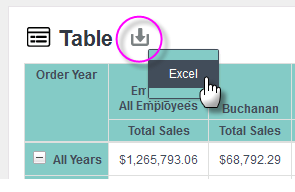
Data from the Dimension Grid table can be exported to Excel using the Export icon, circled above.
Logi Studio includes a Dimension Grid Wizard that can add and configure all of the elements necessary to work with Logi XOLAP for you. For information about this wizard, see Dimension Grid Wizard.