Configuring the Data Cube
In order to create the data cube, we need to use a datalayer to retrieve the data and several XOLAP-family elements to define the aspects of the cube related to that data.

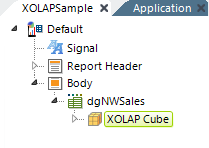
As shown above, the XOLAP Cube element is added to a definition as a child of the Dimension Grid.

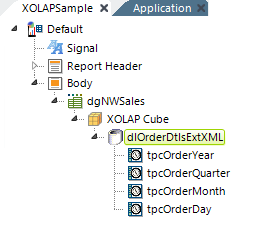
Next, a datalayer appropriate to our data source is added to retrieve the data. As shown above, any of the usual datalayer child elements (in this case, Time Period Columns) can be added as well, to shape the data as desired.
The actual Source attribute value for the DataLayer.SQL element in this example is:
SELECT [Order Details Extended].UnitPrice, [Order Details Extended].Quantity,
[Order Details Extended].ExtendedPrice, Categories.CategoryName,
Products.ProductName, Orders.OrderDate, Customers.CompanyName,
Customers.Country, Customers.Region, Customers.City, Employees.LastName, Employees.FirstName
FROM [Order Details Extended] INNER JOIN
Orders ON [Order Details Extended].OrderID = Orders.OrderID INNER JOIN
Products ON [Order Details Extended].ProductID = Products.ProductID INNER JOIN
Categories ON Categories.CategoryID = Products.CategoryID INNER JOIN
Customers ON Customers.CustomerID = Orders.CustomerID INNER JOIN
Employees ON Employees.EmployeeID = Orders.EmployeeID
Given that we're analyzing the data from a number of tables, the large number of joins is typical of Dimension Grid queries.

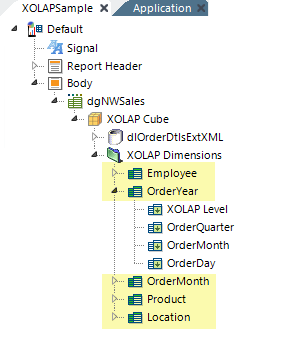
Now we add, as shown above, a XOLAP Dimensions element and, beneath it, a XOLAP Dimension element. The former is just a container, without any attributes, and can have many XOLAP Dimension children. The latter provides a way to "slice" data in the Dimension Grid.
There can be multiple dimension child elements, and each contains one or more XOLAP Level elements, enabling the creation of a general-to-specific hierarchy of data. For example, a single-level dimension could be based on a data field indicating the marital status of a customer, while a multi-level dimension could reflect the location of a customer, with levels for country, state, city, and street address.
The XOLAP Dimension element's Dimension Name attribute value appears as an option in the Dimension Grid's Rows, Columns, and Filters panels. Dimensions automatically have an "All" category at the highest level. Defining cube levels enables drilling down into the dimension.
The XOLAP Level element's attributes identify the data column which contains the value at a dimension level.
Sorting Dimensions by Dates
Dates in dimension values are sorted as strings, which can be confusing. To make a date-type dimension appear in sorted order across the Dimension Grid, ensure that its data is returned into the datalayer as a DateTime value in ISO format (yyyy-mm-dd). To sort the dimension by month and display the month number, set its XOLAP Level element's Format attribute to MM. To sort it by year and display the year number instead, set this attribute to yyyy.

The example above shows the definition after additional dimensions and levels have been added. Look at the image of the Rows panel above and you'll see how the XOLAP Dimension names equate to the options in the panels.
Member Properties and Calculated Measures
The XOLAP Member Property element allows use of a "member property", an additional data field that can be displayed alongside a dimension level on the left axis. It does not have to be related to the dimension of the level to which it belongs.
For example, a member
property for "City Population" data could be defined on the City level of the Customers
dimension, between levels for State and Address. The City Population
will then be available for display whenever the City level of the Customers
dimension is visible on the left axis.

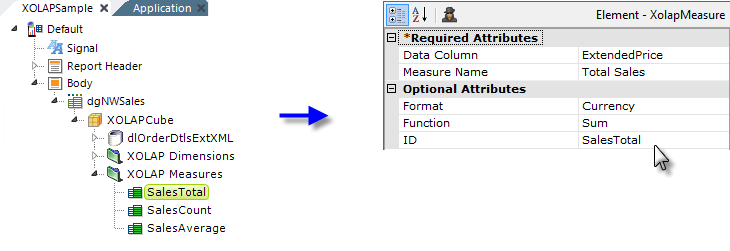
In the example shown above, the datalayer and dimensions are collapsed for reading clarity. A XOLAP Measures element is added, with child XOLAP Measure elements beneath it. The XOLAP Measure element specifies a numeric data-type field that can be displayed in the
grid. Data values are aggregated based on the
Function attribute, and the aggregate value can be formatted using the Format attribute.
The XOLAP Calculated Measure element (not shown) allows you to create measures that use formulae that reference other measures. A new token, @Measure, allows you to reference the values of other measures in those formulae.
The Measure Name attribute for these elements is picked up and shown as an option in the Dimension Grid's Values settings panel.
And, with that, we have everything we need for a functional Dimension Grid.