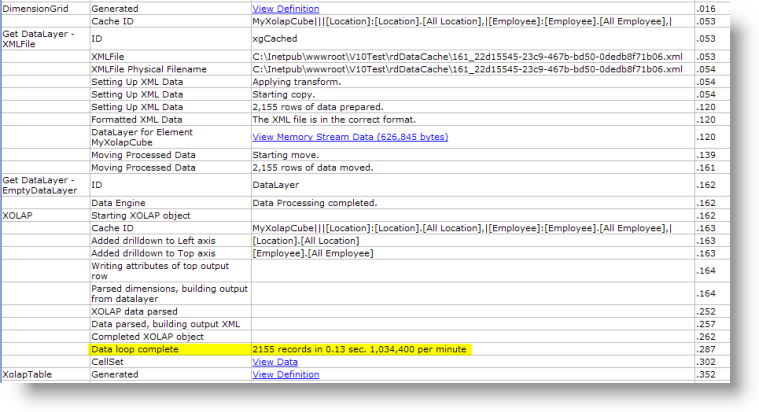
Logi XOLAP on the Debugger Page
The Debugger Trace Page that appears when debugging is turned on contains very useful information when Logi XOLAP is used. For more information, see Debug Reports.
As shown in the example above, the Debugger Trace Page includes the details of Logi XOLAP processing. It also includes the total elapsed processing time in seconds, and an extension of that time in minutes, shown highlighted in yellow. This can be useful in understanding and possibly tweaking performance, and is especially helpful when using DataLayer.XOLAP Query.