Thinkspace - Using the Blue Dot in the Show/Hide Panel
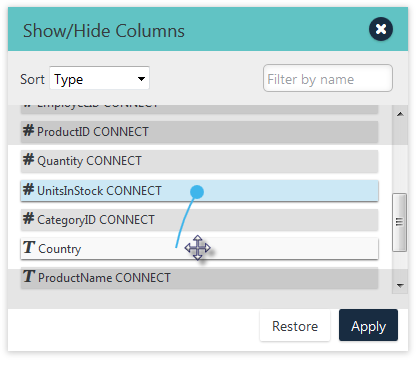
There's another quick and easy way to select columns to be used in a chart, in the Show/Hide Columns panel:

As shown above, open the Show/Hide Columns panel and drag the Blue Dot Connector from one column entry to another. When you drop it, a chart will be created.
This is a useful shortcut if you have a lot of columns and don't want to scroll horizontally looking for the right columns to use.