Creating Report Tabs in a Page Report
Before you can create report tabs, you first need to create a page report or open an existing page report. Then,
- Do either of the following:
- Select Home > New > Page Report Tab.
- Select File > New > Page Report Tab.
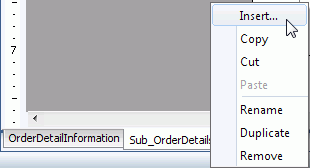
- On the report tab bar, right-click an existing report tab in the report and select Insert on the shortcut menu.
The Select Component for Page Report Tab dialog appears.
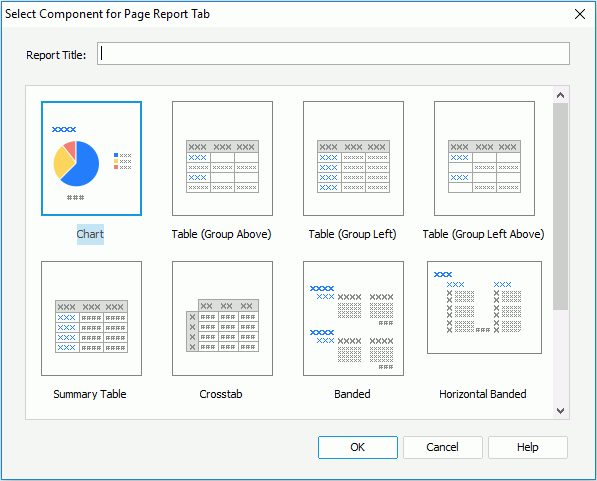
- In the Report Title text box, specify the title of the report tab. If you do not want a title, remove the text in the text box. The title is not used as the report tab name. For how to name a report tab, select here.
- Select the component to add in the report tab.
Logi JReport provides you with the following component types to start a page report tab, which are designed for serving different reporting requirements. The component types available for a report tab vary with the data resource type specified for the page report to which the report tab is to be added, which is determined at the time when the page report is created via the Create Using Business View option. Once defined, all the data components in the page report can only be created on the specified data resource type.
- Chart
Creates a report tab containing a chart. - Table (Group Above)
Creates a report tab containing a table with group information above the detail row. - Table (Group Left)
Creates a report tab containing a table with group information left to the detail row. - Table (Group Left Above)
Creates a report tab containing a table with group information left above the detail row. - Summary Table
Creates a report tab containing a table with only group and summary information. - Crosstab
Creates a report tab containing a crosstab. - Banded
Creates a report tab containing a vertical banded object. - Horizontal Banded
Creates a report tab containing a horizontal banded object. Not available when creating a report tab in a page report that is based on business views. - Mailing Label
Creates a report tab containing a banded object, which is in the form of a mailing label layout. Not available when creating a report tab in a page report that is based on business views. - Tabular
Creates a report tab with a tabular which partitions the report page into several parts. Not available when creating a report tab in a page report that is based on business views. - Blank
Creates a report tab with nothing in it.
- Chart
- Select OK.
- If the chart, table, crosstab or banded component type is selected, the corresponding wizard is displayed for you to create the data component. You can select the Page Setup button in the wizard to set the page settings for the report tab in the Page Setup dialog if required. For details about how to define the data component, see the following topics:
- Inserting a Chart
- Insert a Table
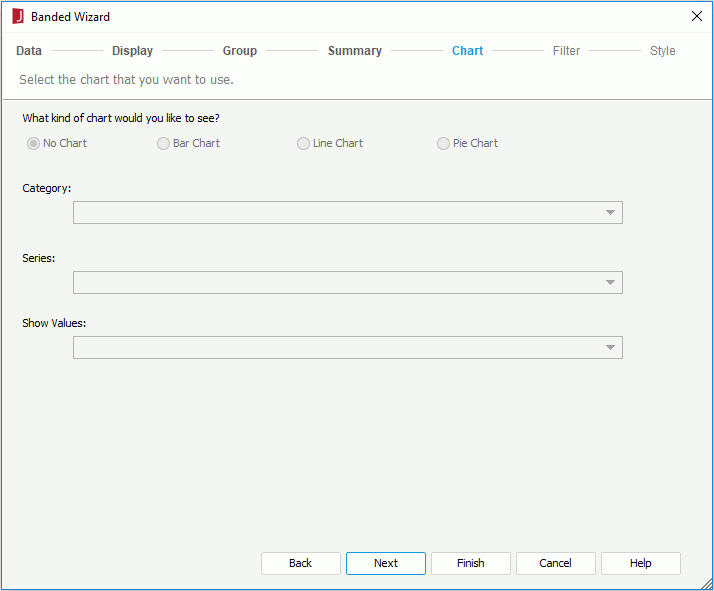
When you create a report tab with a table component in it into a page report that is based on query resources, you can choose to create a chart together with the table in the report body. In the Chart screen of the Table Wizard, select the chart type you like. From the Category drop-down list, select the field you want to display on the category (X) axis of the chart. You can choose from the group by fields of the table on which some summaries are added. Choose the field to be displayed on the series (Z) axis of the chart from the Series drop-down list, where all the group by fields of the table are listed. From the Show Values drop-down list, select the field you want to display on the value (Y) axis of the chart. You can choose from the summary fields which are calculated based on the field you specify to display on the category axis of the chart.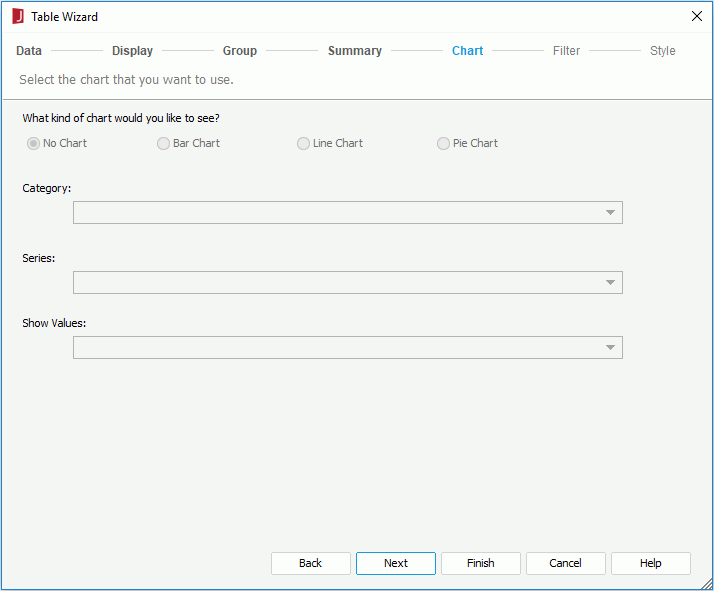
- Insert a Crosstab
When you create a report tab with a crosstab component in it into a page report that is based on query resources, you can choose to create a chart together with the crosstab in the report body. In the Chart screen of the Crosstab Wizard. Select the chart type you like, from the Category and Series drop-down lists, where all the fields that have been added to the columns and rows of the crosstab are listed, choose the fields to be displayed on the category (X) axis and series (Z) axis of the chart, then select the field you want to display on the value (Y) axis of the chart from the Show Values drop-down list, you can choose from all the aggregate fields in the crosstab.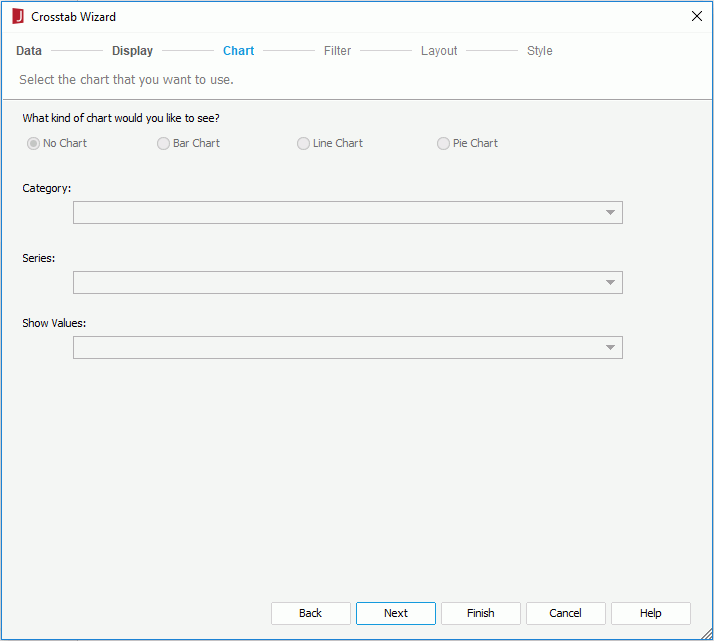
- Inserting a Banded Object
A banded object in a page report that is based on query resources can be a standard banded object, a horizontal banded object or a mailing label banded object. The steps for creating a banded object in any of the three layouts are mostly the same, just that the banded object is positioned differently in each layout: one in a vertical way, one horizontally and one in the form of mailing labels.In addition, when you create a report tab with a banded object in it into a page report that is based on query resources, you can choose to create a chart together with the banded object in the banded header panel. In the Chart screen of the corresponding banded wizard, select the chart type you like. From the Category drop-down list, select the field you want to display on the category (X) axis of the chart. You can choose from the group by fields of the banded object on which some summaries are added. Choose the field to be displayed on the series (Z) axis of the chart from the Series drop-down list, where all the group by fields of the banded object are listed. From the Show Values drop-down list, select the field you want to display on the value (Y) axis of the chart. You can choose from the summary fields which are calculated based on the field you specify to display on the category axis of the chart.
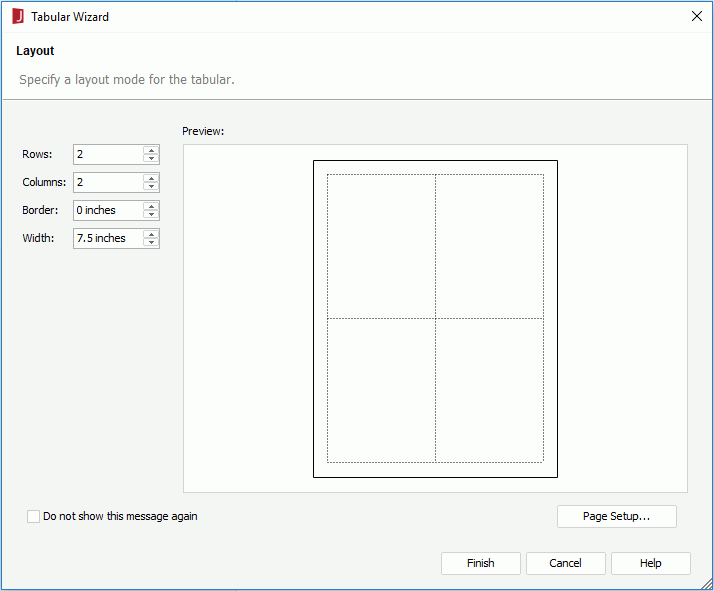
- If Tabular is selected, the Tabular Wizard is displayed. Specify the number of rows and columns, and the border width and tabular width respectively. You can also select the Page Setup button to set the page settings for the report tab in the Page Setup dialog if required. When the tabular is created, you can insert components and texts into the tabular cells and their layout will be controlled by the cells. A tabular helps you better design the report page. For details about how to work with tabulars, refer to Tabulars.
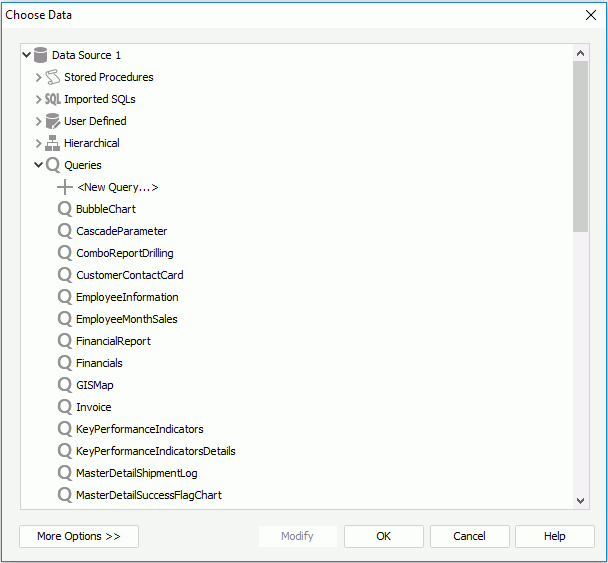
- If Blank is selected, the Choose Data dialog is displayed, prompting you to select the data resource on which to create the report tab. Depending on the data resource type the page report to which the report tab is to be added is specified, you can choose either from query resources or business views in the current catalog. When the blank report tab is created, you can then insert the required objects into the report tab as described in the Components chapter.
When selecting from query resources, if the given data resources are not what you want, you can select the first item in the corresponding resource node to create one. When a query is selected, you can select the Edit button to modify the query if required. Then a new dataset based on the selected data resource is created in the page report. If you want to use an existing dataset in the current page report for the page report tab, select the More Options button, then check the Existing Dataset radio button and select a dataset. You can select the Edit button to modify the selected dataset in the Dataset Editor if necessary, or select the <New Dataset...> item to create a new dataset in the page report to use. It is always better to use an existing dataset rather than create a new one. Even when the two datasets are based on the same query, Logi JReport will still run the query separately for each dataset.
- If the chart, table, crosstab or banded component type is selected, the corresponding wizard is displayed for you to create the data component. You can select the Page Setup button in the wizard to set the page settings for the report tab in the Page Setup dialog if required. For details about how to define the data component, see the following topics:
 Previous Topic