Inserting a Crosstab
With the crosstab wizard, it is easy to create crosstabs in a report; however, the wizard varies with the data resource type used to create the crosstab: business view or query resource.
A web report and library component can only use business views as the data resource. For a page report it can be created either based on query resources or business views, which is determined at the time when the page report is created by the Create Using Business View option. Once defined, all the data components in the page report can only be created on the specified data resource type.
A crosstab can be inserted in the report areas listed in Component placement.
Below is a list of the sections covered in this topic:
Inserting a Crosstab Based on a Business View
- Position the mouse pointer at the destination where you want to insert the crosstab.
- Do one of the following:
- Drag the Crosstab button
 from the Grid category of the Components panel to show the wizard.
 - Select Insert > Crosstab or Home > Insert > Crosstab.
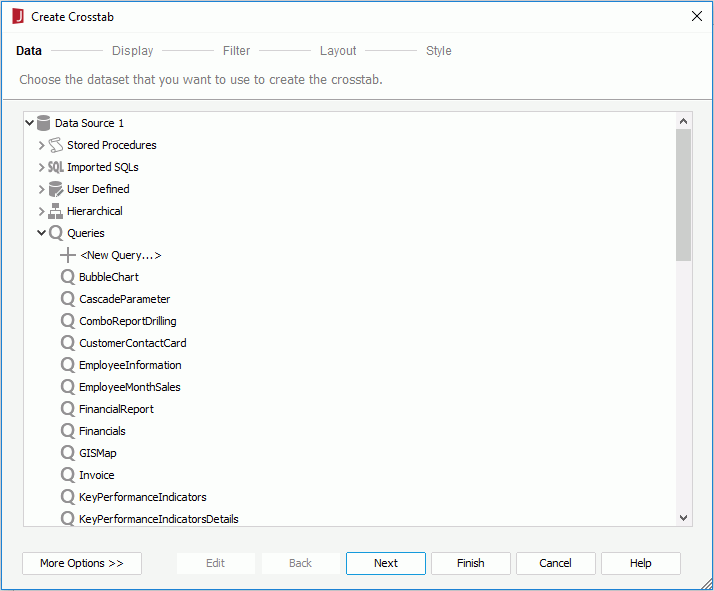
The Create Crosstab wizard appears.
- Drag the Crosstab button
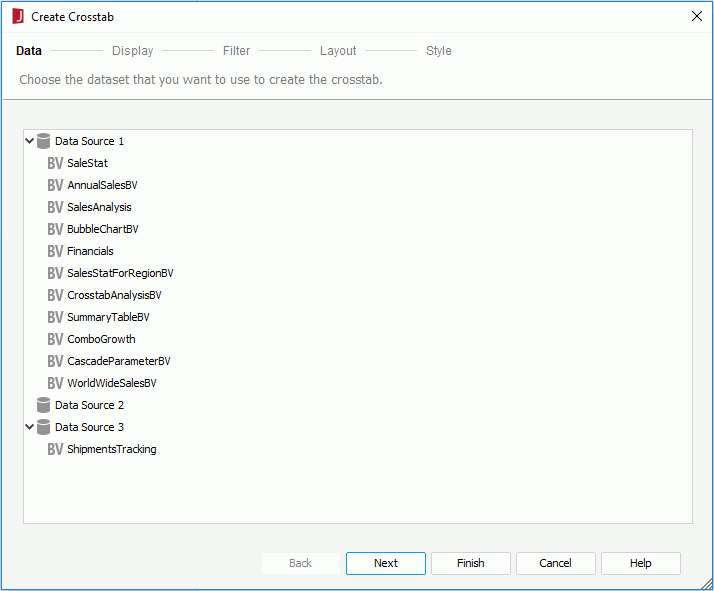
- In the Data screen, select a business view in the current catalog on which the crosstab will be created.
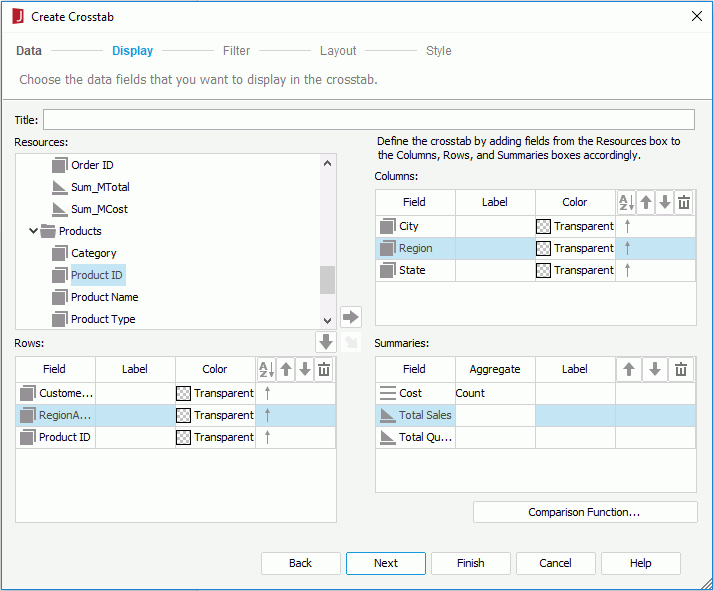
- In the Display screen, specify a title for the crosstab in the Title text field. In the Resources box, add the required fields or dynamic formulas to be displayed on the columns and rows of the crosstab. To add a field to the Columns or Rows box, select it in the Resources box and select
 or
or  beside the corresponding box, or drag and drop it from the Resources box to the target box. If a field is not required, select it and select
  or drag and drop it to the Resources box. You can add or remove only one field at a time. For the added fields, you can specify their display names in the Label column which will label the rows and columns (by default the Label column is blank and no label will be created for the rows and columns), the background color in the Color column, set the sorting manner of the field values by selecting
  , and adjust their display order by selecting
  or
or  . Then, select the view elements or create dynamic aggregations and add them as aggregate fields to the Summaries box using either
  or by dragging and dropping, specify the aggregate functions for the added fields, edit the display names of the fields in the Label column to label the summaries, and adjust their display order by selecting
  or
or  . If necessary, select the Comparison Function button to set the comparison function for the aggregate fields.
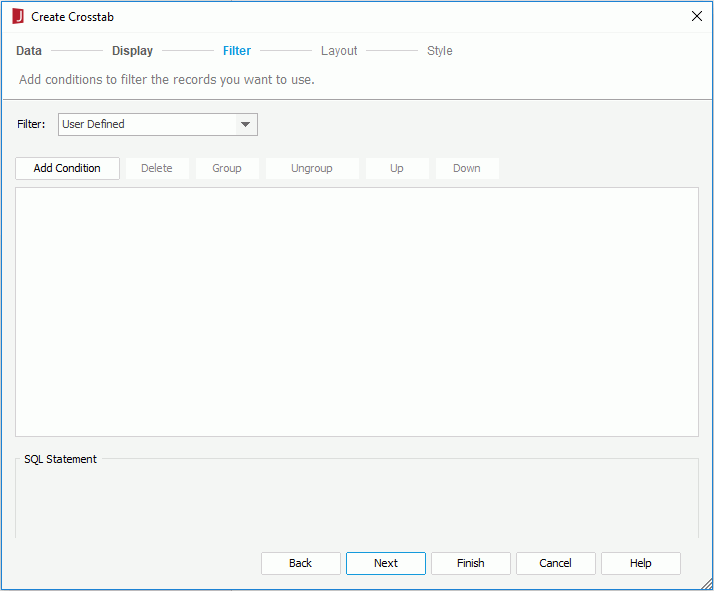
- To apply filters to the crosstab so as to reduce the data displayed in the crosstab, go to the Filter screen. Select a predefined filter of the specified business view if there are any from the Filter drop-down list to apply, or select User Defined in the list to define a new filter. For how to define a filter, refer to Filtering the Data.
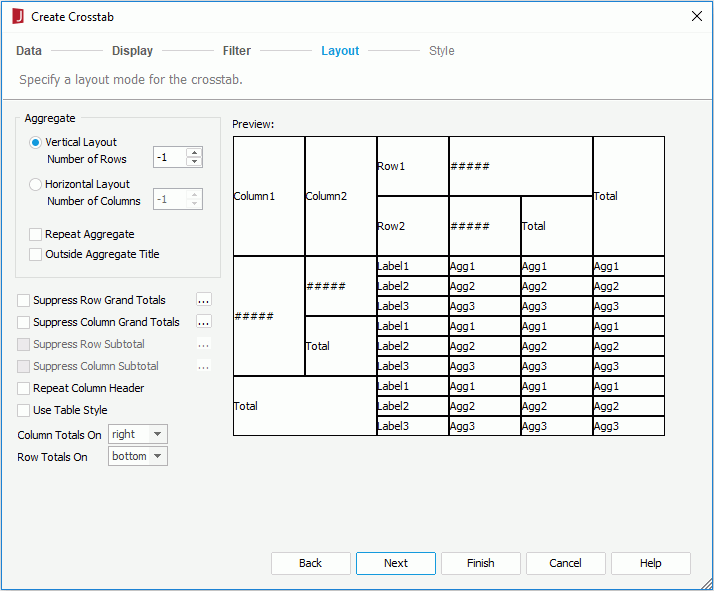
- In the Layout screen, specify the layout properties of the crosstab. When you have multiple aggregate fields in the crosstab, it is usually best to change to Horizontal Layout to make the report more readable.
- In the Style screen, set a style for the crosstab.
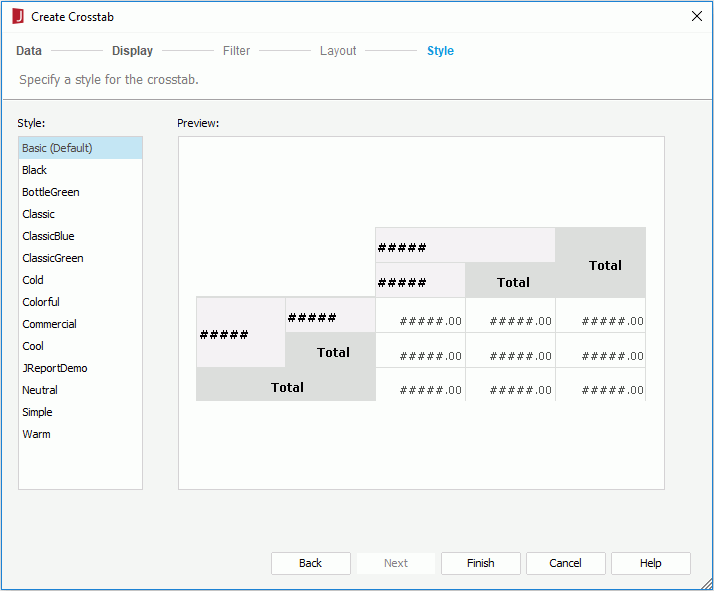
If you have specified to insert the crosstab into a banded object, by default the crosstab will inherit its parent's style. If you want to apply another style to the crosstab, uncheck the Inherit Style option and then select the required style from the Style box. For more information, see Inheriting Styles.
- Select Finish to insert the crosstab.
If you have specified to insert the crosstab in the report body or tabular cell, the crosstab will be inserted there upon selecting the Finish button; otherwise, you need to select the mouse button in the destination once again in order to insert the crosstab there.
Inserting a Crosstab Based on a Query Resource
- Position the mouse pointer at the destination where you want to insert the crosstab. It can be in an empty area of the page report or inside a banded object.
- Select Insert > Crosstab or Home > Insert > Crosstab. The Create Crosstab wizard appears.
- In the Data screen, select the data resource on which to create the crosstab. If the given data resources are not what you want, select the first item in the corresponding resource node to create one. When a query is selected, select the Edit button to modify the query if required. Then a new dataset based on the selected data resource is created in the page report.
- Check the Existing Dataset radio button and select a dataset. You can select the Edit button to modify the selected dataset in the Dataset Editor if necessary, or select the <New Dataset...> item to create a new dataset in the page report to use. It is always better to use an existing dataset rather than create a new one. Even when the two datasets are based on the same query, Logi JReport will still run the query separately for each dataset.
- Check the Current Dataset radio button to make the crosstab inherit the dataset from its parent.
- In the Display screen, specify the fields you want to display in the crosstab.
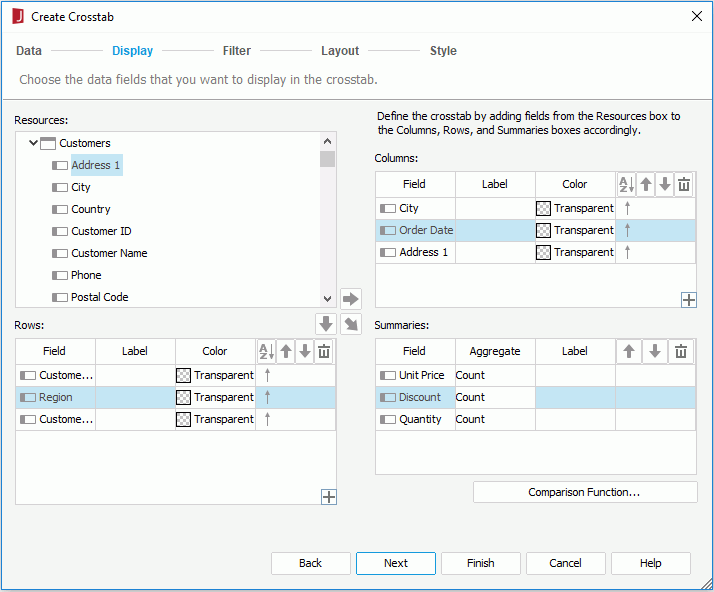
In the Columns box, add the fields to be displayed on the columns of the crosstab. To add a field, select it in the Resources box and select
 or drag and drop it from the Resources box to the Columns box. If you want to display compound column groups in the crosstab, select
  at the right bottom corner of the Columns box to create the column groups, then select each column group and add the required fields to it. For the added fields, you can specify their display names in the Label column which will label the columns (by default the Label column is blank and no label will be created for the columns), modify their background color in the Color column, set the sorting manner of the field values by selecting
  , adjust their display order by selecting
  or
or  , and remove an unwanted field by selecting it and selecting
  or dragging and dropping it to the Resources box. When there are compound column groups, you can also select a column group and select
  or
or  to change the group order, or select
  or drag and drop it to the Resources box to remove it.
In the Rows box, add the row fields of the crosstab using the same way for adding column fields. You can also create compound row groups.
In the Summaries box, add the fields as aggregate fields to summarize data in the crosstab using either
 or by dragging and dropping. You can also create Crosstab Formulas and add them as aggregate fields so as to apply custom aggregate functions in the crosstab. If you have created compound column and row groups in the crosstab, you can add aggregate fields for each combination of the compound groups by selecting a row/column group and a column/row group and then adding the required fields. For the added aggregate fields, you can modify their aggregate functions, edit the display names in the Label column to label the summaries, adjust their display order by selecting
  or
or  , and when an aggregate field is not required, you can select it and select
  or drag and drop it to the Resources box to remove it. If necessary you can define Comparison Function for the added aggregate fields.
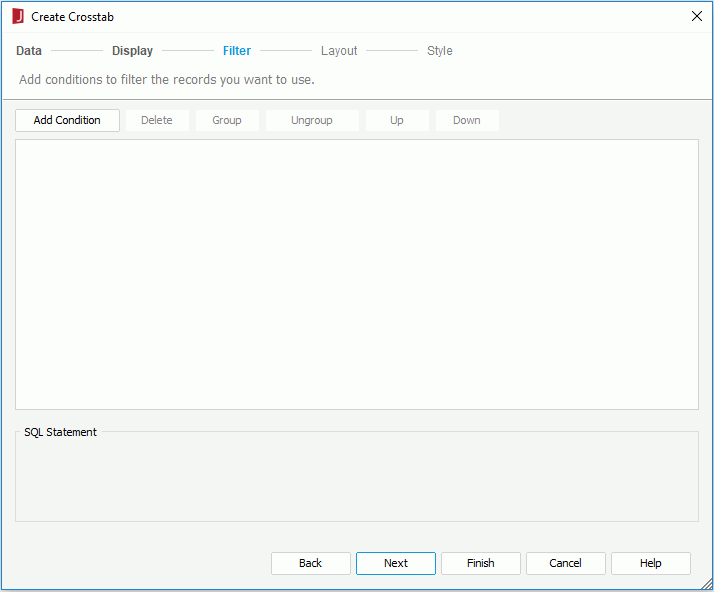
 - To apply filters to the crosstab so as to reduce data displayed in the crosstab, go to the Filter screen and define the filter conditions. For how to define a filter, refer to Filtering the Data.
- In the Layout screen, specify the layout properties of the crosstab. When you have multiple aggregate fields in the crosstab, it is usually best to change to Horizontal Layout to make the report more readable.

- In the Style screen, set a style for the crosstab.
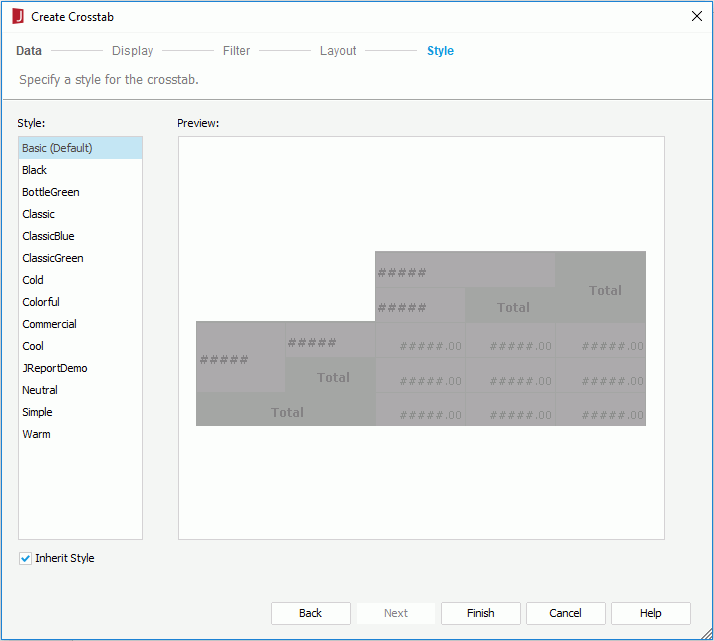
When you have specified to insert the crosstab into a banded object, by default the crosstab will inherit its parent's style. If you want to apply another style to the crosstab, uncheck the Inherit Style option and then select the required style from the Style box. For more information, see Inheriting Styles.
- Select Finish to insert the crosstab.
If you have specified to insert the crosstab in the report body or tabular cell, the crosstab will be inserted there upon selecting the Finish button; otherwise, you need to select the mouse button in the destination once again in order to insert the crosstab there.
If you want to use an existing dataset in the current page report to create the crosstab, select the More Options button and then:
Besides using the wizard, you can also drag a blank crosstab to a page report that is based query resources. To do this:
- From the Grid category of the Components panel, drag the Crosstab button
 to the destination in the page report which allows the insertion of a crosstab. A blank crosstab is then created.
 - In the Data panel, select the dataset in the current page report with which you want to create the crosstab from the dataset drop-down list, or select <Choose Data from...> from the list to create a new a dataset for the crosstab.
- Drag the required fields from the Data panel to the position of row header, column header and aggregate cell in the crosstab. Then the rows, columns and aggregates will be created.
When the crosstab is inserted into a banded object, you can set up data container link between the crosstab and its parent.
See an example: The SampleComponents catalog, included with Logi JReport Designer, contains reports that have examples of report component types. For the crosstab component example, open <install_root>\Demo\Reports\SampleComponents\Crosstab.cls.
 Previous Topic