Logi Info Dashboard
Dashboards provide an organized arrangement of visualizations in tabs and panels. Like all super-elements, they have a built-in user interface and specialized functionality.
The following topics introduce Logi Info developers to one of the "super-elements", the Dashboard:
- Using the Dashboard Element
- Using the Panel and Panel Content Elements
- Working with Dashboard Tabs
- Saving Dashboard Settings
- Creating a Default Panel Arrangement
- Using Analysis Filters with Dashboards
- Using the Panel Parameters Element
- Using the Refresh Element Timer
- Using Action.Add Dashboard Panel
- Customizing Dashboard Appearance
Information about using a Dashboard, intended for end-users, is available in Dashboard for End Users.
About the Dashboard
A Logi "Dashboard" is a collection of Dashboard panels, each containing a data visualization (table, chart, gauge, etc.). A Dashboard can be configured to allow end-users to customize it at runtime by adding, removing, or rearranging its panels. A Dashboard can also be configured to have tabbed pages, so that different collections of Dashboard panels can be viewed. Dashboard panel content is interactive and end-users can be allowed to vary the data criteria for them at runtime. Links within the panels and visualizations can be used to drill-down and drill-through to supporting data. Dashboards present a very flexible way of presenting a range of information that's easy to take in with a single glance.

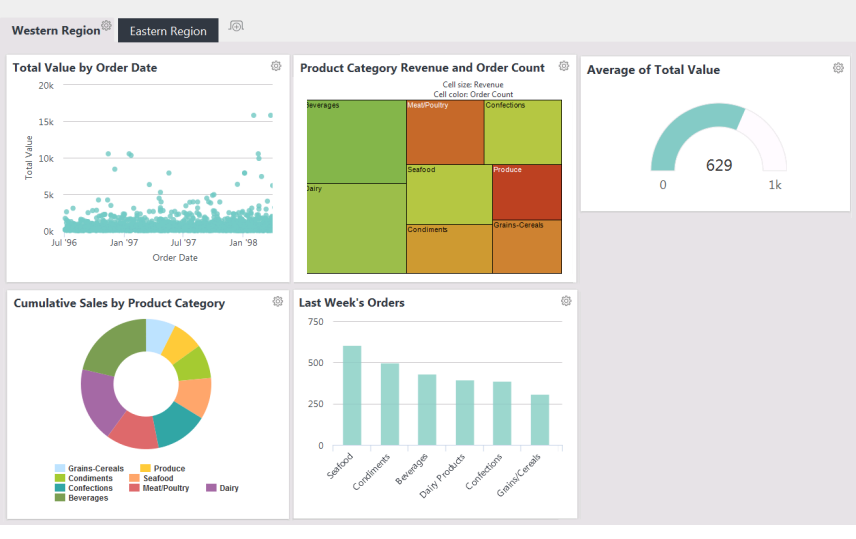
A simple Dashboard, with no user customization features, styled using the standard Signal theme, is shown above.

In the example above, we see a more complex Dashboard which includes tabs and has end-user customization enabled.
Dashboards are created using the Dashboard element, and its child elements, and they provide attributes that control customization features. AJAX-based techniques are used for web server interactions, allowing selective updates of Dashboard panels. There's also a mechanism for saving runtime customizations between sessions, on an individual-user basis.
Dashboard Layout
A Dashboard or tab's layout usually consists of one or more columns
and, if the Dashboard is configured to be adjustable, users can
drag-and-drop the panels into the columns and the arrangement of their
choice.

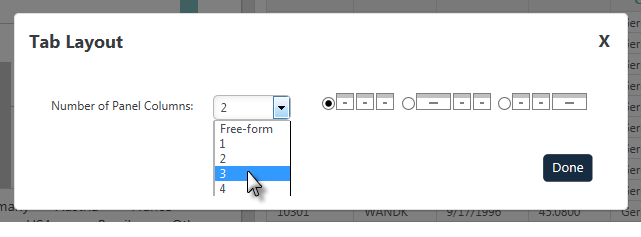
If the Dashboard is adjustable, then using the Dashboard or tab's gear
icon and Settings menu, users can change the number of columns in a tab or
Dashboard, as shown above.
Depending on your application's configuration, a "Free-form Layout"
option may also available. If it's enabled, users can resize and rearrange
Dashboard panels without regard to any predetermined columns.
Dashboard Panels
Dashboard panels are the basic building blocks of the Dashboard and can be added programmatically or dynamically at runtime.

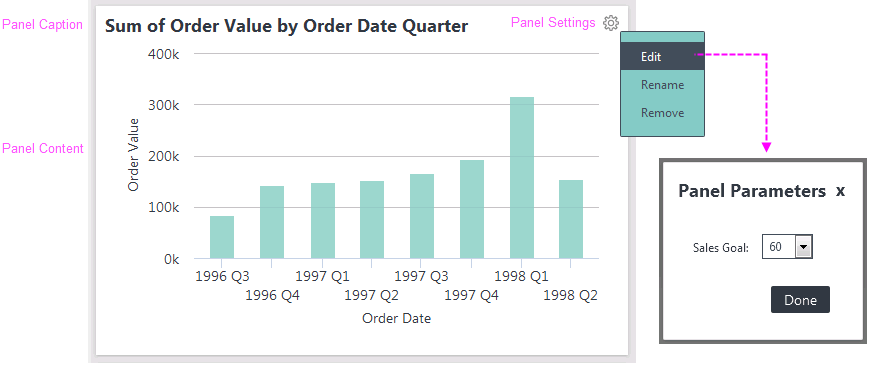
As shown above, panels have a Caption and content, and may be configurable by users at runtime in other ways. If the Dashboard is adjustable, a panel can have its caption changed or be removed from its Dashboard via its Settings menu. If the panel has been created with parameters, users can adjust the parameter values, affecting the panel content.
In the definition, the Panel element creates a Dashboard panel. Its Panel Content and Panel Parameters child elements are used to create and configure the panel.

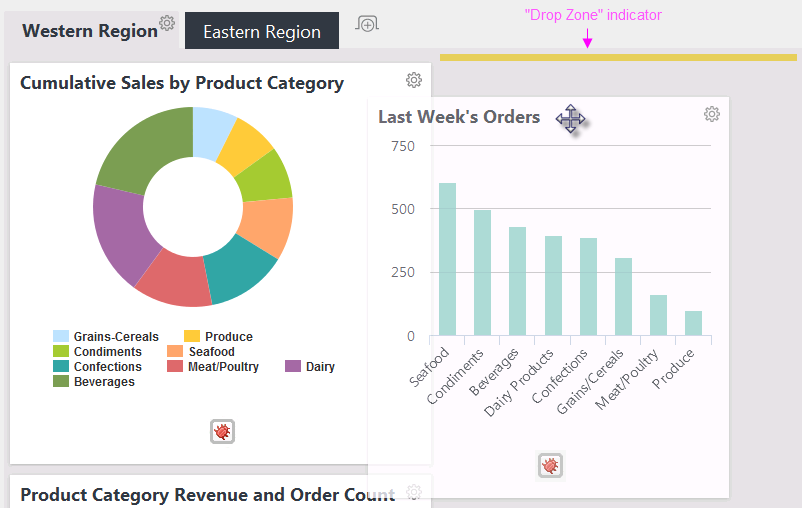
At runtime, users can drag a panel to a new location by clicking on its caption bar, as shown above (note the cursor change). As the panel is dragged into a different column or position, a yellow "drop zone" indicator appears to help snap the panel into its new location.
In a columnar layout, panels will automatically resize based on the
width of the column they're dropped into, and the column's width is
determined by the widest panel it contains. If the contents of a panel are widened, then the panel and its column will widen, too.
This is a change from panel behavior in previous versions! In a columnar layout, panels will automatically resize based on the width of the column they're dropped into. Column width is a fixed width,
determined by the layout chosen and screen width. Panel content will
be automatically scaled up to the maximum width that fits in the panel.
In support of this change, charts in panels in columnar layouts no
longer have horizontal resizing handles.
The Dashboard Wizard
The "Create a Dashboard" wizard is one of Logi Studio's collection of wizards. This wizard assists developers in creating Dashboards by populating the report definition with the necessary Dashboard-related elements. More information about this wizard is available in our Dashboard Wizard for Developers.