Creating Dataviews
The fundamental purpose of DataHub is to create "Dataviews", a view of cached data, which can be consumed by other Logi products. This topic discusses the creation and management of Dataviews.
- About Dataviews
- Creating a Dataview
- Using Custom SQL Queries
- Dataview Loading
- Data Enrichment
- Managing Dataviews
About Dataviews
Logi DataHub is a data virtualization product that connects to multiple sources, retrieves and caches data for high-performance, and prepares data in intuitive ways, so you can deliver efficient reporting and analysis that doesn't affect transactional systems.
DataHub includes DataSmart profiling, which automatically identifies the types and formats of your data and provides easy ways of enriching it through new calculations and manipulation of multi-part data.
It uses its own repository database to store prepared data and that database can be accessed by a Logi Info application just like any other datasource. That data is available as a "Dataview", which can be accessed as a by other Logi products.
A Dataview is defined using a Dataview definition or "DVD". It describes the data sources to connect to, the data objects and columns to retrieve, and the relationships between objects. You create a Dataview by specifying a DVD.
Creating a Dataview
The following discussion assumes you've already created one or more data Sources, by Connecting to Databases or Connecting to Applications. Creating a Dataview directly from data in an Excel or CSV data file is discussed in Using Excel and CSV Data.
There are multiple paths in DataHub to the Create a New Dataview page, including:
- Dataviews menu option
 Create a New Dataview
 - Sources menu option
 "Gear" icon in Source pill
 Create Dataview
Once you arrive at the Create a New Dataview page, click the From Source tab:
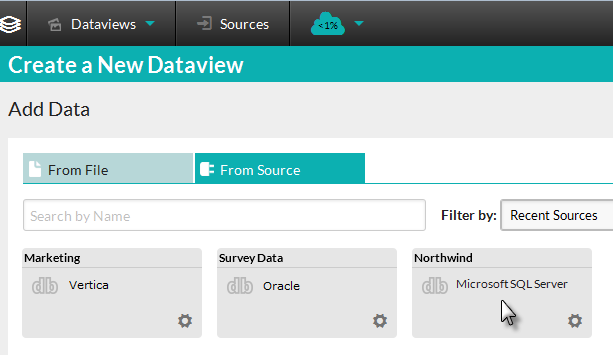
Your data Sources will be displayed as "pills", as shown above. Click one to create a Dataview that uses it, and the Dataview Configuration tab will appear:
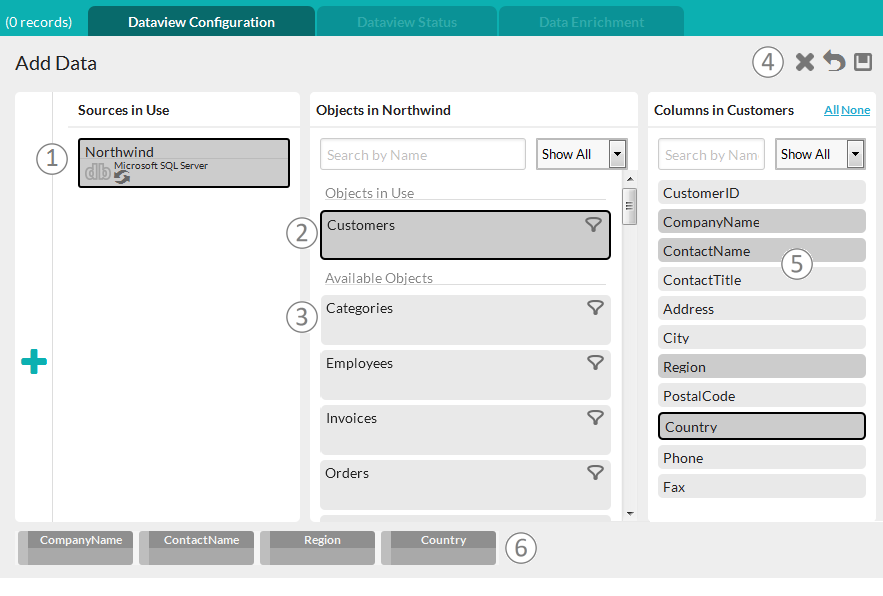
Here are the important features of this tab, keyed to the image shown above:
- Sources in Use - This panel displays the data Sources in use by this Dataview. Click the Add Data icon
 to add more Sources ("blending data" from multiple sources is discussed in Blending Multi-Source Data).
 - Data Objects - This panel displays a list of the data objects (tables and views) available in the selected Source. The list can be searched and filtered using the included controls.
Click an object to select it. When you do, its columns appear in the Columns panel. The Filter icon allows you to filter the data and its use is discussed in, Filtering Data on Load. If you select any of an object's columns, the object will be placed in the "Objects in Use"
list.
 - Available Objects - This is a list of the data objects that are available for use but haven't been used yet.
- Action Icons - Click these icons to Cancel
 definition creation, Reset
  all selections to their defaults, or Save
  your definition.
 - Columns - This panel displays a list of the columns available in the selected data object. The list can be searched and filtered using the included controls, and the All and None links can used for bulk selection. Click a column to add or remove it from the Dataview.
- Column Pills - When you select a column in the Columns panel, it will be represented by a "pill" at the bottom of the page. These provide a representation of the data, in tabular form, included in the Dataview.
![]() You can also define relationships (joins) between data objects in your Dataview. For information about how to do this, see Creating Data Relationships.
You can also define relationships (joins) between data objects in your Dataview. For information about how to do this, see Creating Data Relationships.
When you have selected your Source(s), Objects, and Columns, click the Save icon ![]() and you'll be prompted to provide a name for your Dataview. It will be saved and then immediately loaded.
and you'll be prompted to provide a name for your Dataview. It will be saved and then immediately loaded.
Using Custom SQL Queries
![]() You can use your own custom SQL queries to create a Dataview, in v2.2 SP1 and later.
You can use your own custom SQL queries to create a Dataview, in v2.2 SP1 and later.
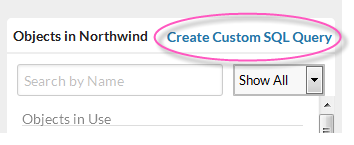
If the selected data source is a SQL database, at the top of the middle panel in the Dataview Configuration tab, you'll see the Create Custom SQL Query link, circled above.
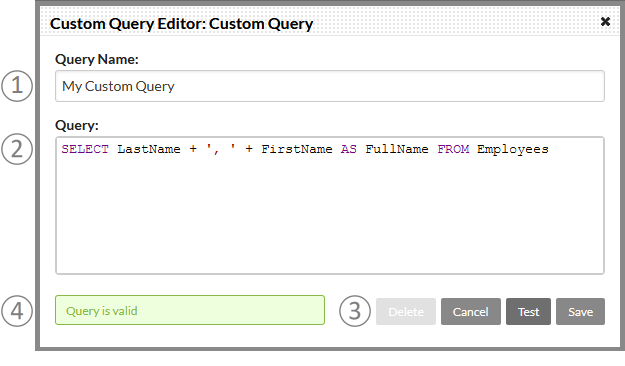
When you click the link, the Customer Query Editor dialog panel, shown above, will be displayed, with these controls:
- Query Name - Enter a name for your custom query.
- Query - Enter your SQL query, using the correct syntax for the data source database.
- Actions - Click the action buttons to Test your query or Cancel the operation. You must successfully test your query before the Save button will be come active. The Delete button will only be visible if you're editing an existing custom query; you can use it to delete the custom query.
- Query Test Result - When you click Test, the query will be validated and the results shown here.
Once you test and save your custom query, it will appear in the list of objects in the middle panel:
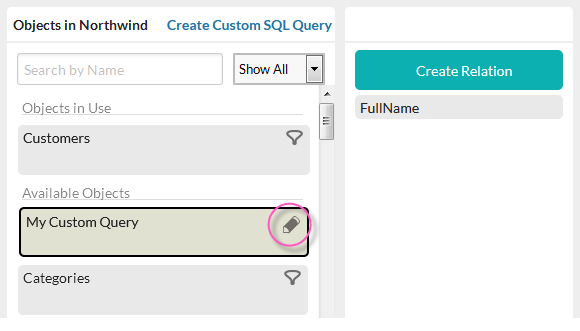
Its columns will appear in the right-hand panel. Like other columns, they can be used to create relationships with other data.
To edit or delete a custom query, click the Edit icon, shown circled above. Note that you can only modify or delete a custom query if no Dataviews are dependent upon it.
Dataview Loading
Data is loaded for the first time as soon as you save a new Dataview definition. You can also "refresh" the data manually at any time and schedule reloading to occur at regular intervals. Loading progress and actions are seen in the Dataview Status tab:
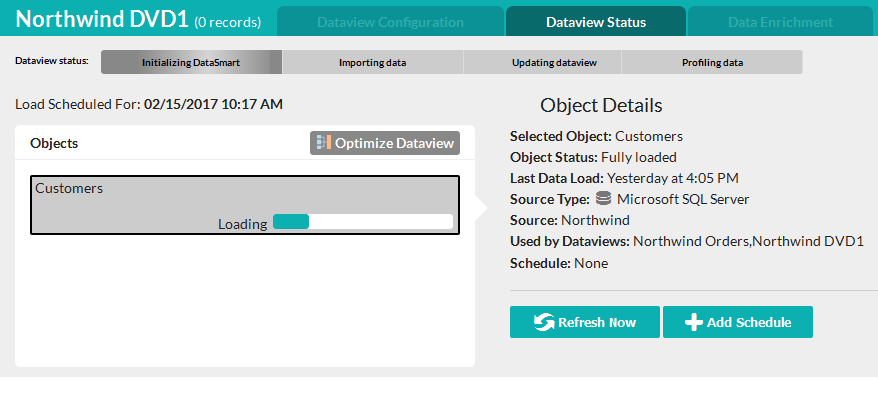
Several status indicators will show you the progress of the load. The process includes four steps:
- DataSmart initializing - DataHub is waiting for the scheduler and connection code to initialize.
- Importing data - A connection is made to the Source, the data is requested, and retrieved.
- Updating dataview - The retrieved data overwrites, or is appended to, the existing cached data.
- Profiling data - DataHub identifies column types, designates look-up columns, and sets the correct column order and sorting.
When loading completes, the Object Details will be updated...

...and you'll see a notification indicator in the menu bar, as shown above. Hover your mouse cursor over it to read the message.
![]()
If, in the course of loading the data, DataHub detects the right conditions, the button shown above will be displayed. An optimized Dataview consolidates all the underlying objects into a single table in the DataHub repository database, considerably improving performance. Click Optimize Dataview to begin the optimization process if you want to do this.
Refreshing the Data
Clicking Refresh Now will display a prompt to select the type of refresh:
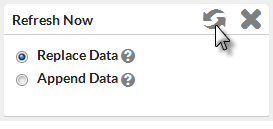
If you select:
- Replace Data - All data in the cache will be replaced by new data retrieved from the data source.
- Append Data - New data retrieved from the data source will be appended to the existing data. Existing data will not be updated.
Click the Refresh Now icon ![]() to start the data loading operation immediately.
to start the data loading operation immediately.
Clicking Add Schedule will let you define a scheduled refresh and is discussed in a separate document, Scheduling Data Refreshes.
Data Enrichment
DataHub's Data Enrichment feature allows you to specify a number of properties for Dataview data columns, including their order, data type, display format, and more, and to create custom calculated columns. You can also create custom data conversion and "multi-part" columns. This feature is discussed in a separate document, Applying Data Enrichment.
Managing Dataviews
As you create Dataviews, they're represented in the Dataview page with graphic "pills":
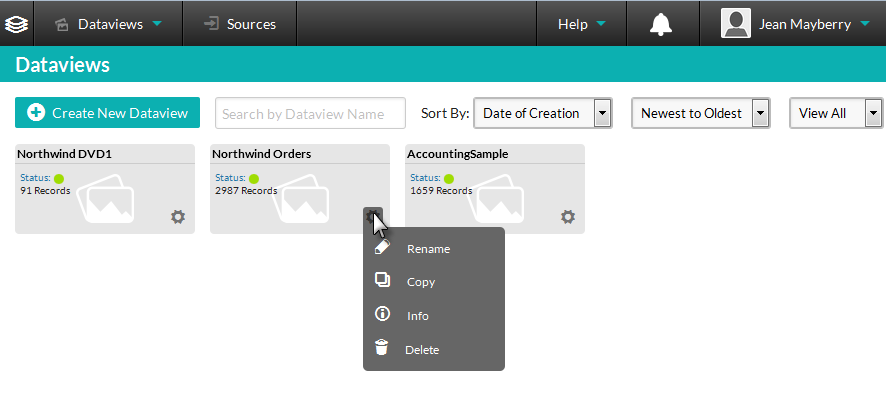
The collection of pills can be searched and filtered using the provided controls.
Each pill displays the Dataview name, its status, and its loaded record count, as shown above, and includes a "gear" icon. Hovering your mouse cursor over the icon displays a menu of management actions. The Delete option will only be included if you're the user who created the Dataview.