Blending Multi-Source Data
Blending data from multiple sources lets you get unique datasets in DataHub. This topic presents an example of how to configure a Dataview to make use of this feature.
About Data Blending
The term "data blending" describes the retrieval of data from disparate data Sources for use in your DataHub Dataview. For example, you could bring together data from a database, an Excel spreadsheet, and an application, all in one Dataview.
Just as relational databases use "foreign key" relationships between tables, all of the data objects you want to blend in a Dataview must share at least one column of similar content. There must be a way to relate records in the primary data source with records in the secondary data source. Part of the process of creating a Dataview using disparate data is the specification of the relationship between the data sources.
Starting at the Create New Dataview page, the steps you need to take to blend data are:
- Identify the primary objects and columns to be included in the Dataview.
- Select a different data source.
- Select an object from the secondary source.
- Build a relationship between the selected object and objects/columns already included in the Dataview.
- Select columns from the selected data source to be included in the Dataview.
- Repeat the process until you've identified all of the information required for the Dataview.
Let's see how this is done.
Data Blending Example
This example will demonstrate how to blend data from a relational database with information from an Excel spreadsheet. In our example data, we have a list of Invoices in an Excel worksheet and we want to blend that information with customer Order information from a SQL database.
To save time, we're not going to show you the steps required to create the SQL Server data Source or the selection of the desired database objects. We'll just drop into the example at the point where we're ready to blend data.
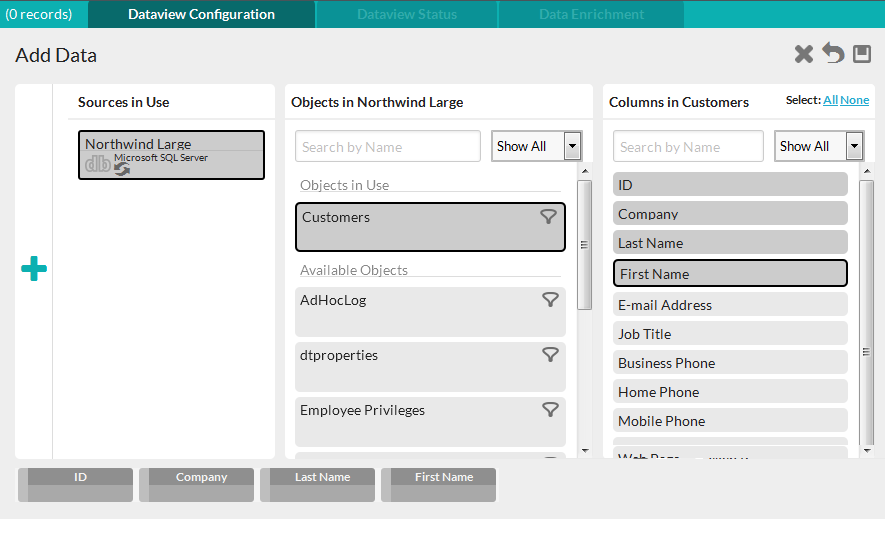
The Dataview, as configured so far, is shown above. Notice the column pills at the bottom of the page, for the columns we've already selected.
The next step is to blend information from an Excel spreadsheet into the
Dataview. We'll start by clicking the Add Data icon ![]() at the left edge of the page:
at the left edge of the page:
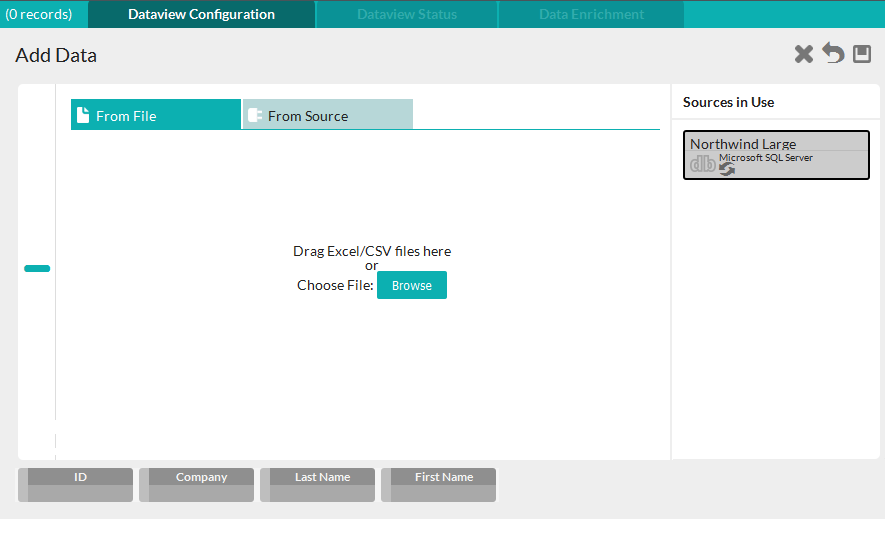
The Sources in Use panel slid to the right and continues to identify the Northwind data source we used to start the Dataview. The Sources page appeared, with its From File tab selected, to let use select another Source.
Now we'll either drag-n-drop the Excel file we want to work with onto the tab or use the Browse button to locate and select it. DataHub will automatically return to the Dataview Configuration tab:
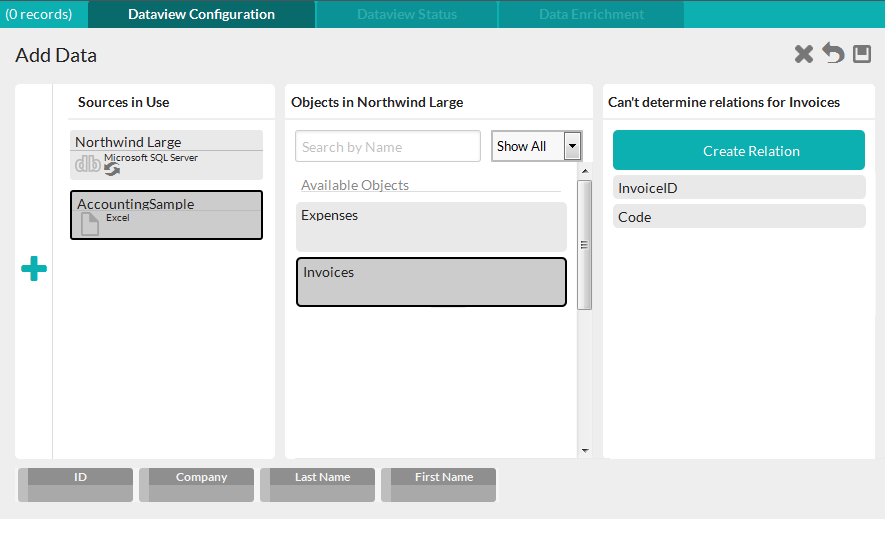
The Excel data source is now selected in the Sources in Use panel, and we'll select the Invoices data object.
The next step is to create the relationship between the Invoices object and the previously selected Northwind objects. Click the Create Relation button in the Columns panel and the Create Relationship dialog box will appear:
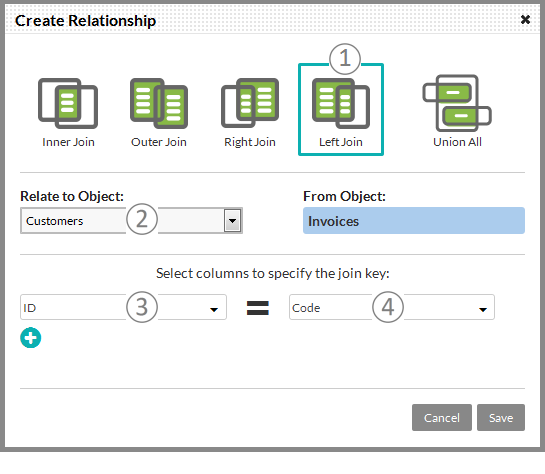
To configure the correct relationship:
- Select the desired relationship, which is Left Join (the default)
- Select the object to relate, which is the Customers table
- Select the "left" column, which is the ID column
- Select the "right" column, which is the Code column. Note that the two related columns do not have to have the same column name.
Click Save to return to the Dataview Configuration
page and select the column from the Excel ![]() Invoices object that we'd like included
in the Dataview.
Invoices object that we'd like included
in the Dataview.
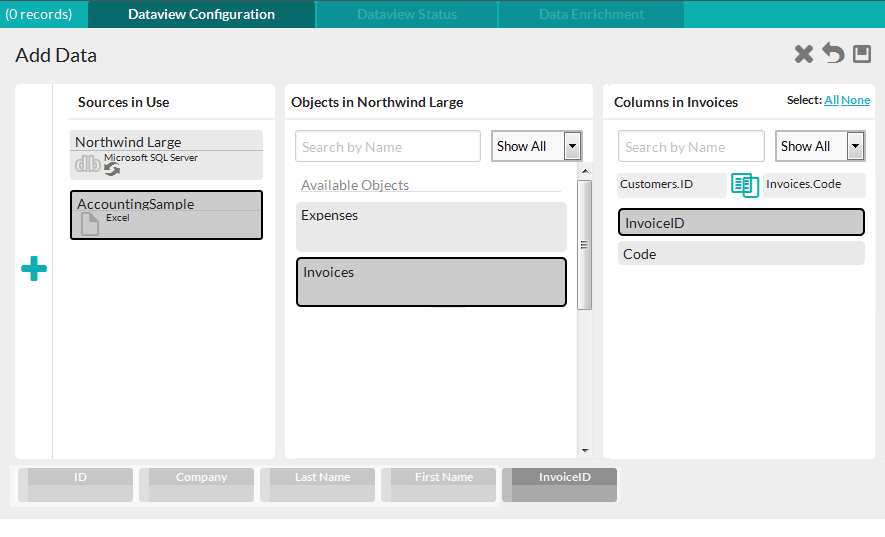
The relationship now appears at the top of the column list in the Columns panel (you can click the join icon to modify the relationship definition), and the selected Excel column is now part of the column pill collection at the bottom of the page.
Click the Save icon to save and then load the Dataview.
And that's all you need to do to create a Dataview with multi-source blended data. However, you may find that you have to rename columns in the Dataview itself for clarity. For example, both the Customer and Supplier tables contained Region and Country columns and DataHub will automatically, intelligently shorten the column names, however, as the Dataview designer you have the option of overriding the derived names.
Our example showed the use of data blending when creating a Dataview, but you have the option of extending existing Dataviews at any time by revisiting the Dataview Configuration tab and adding related content from other sources.