Using Excel and CSV Data
Logi DataHub dataviews can be created using data from Excel spreadsheet (.xls and .xlsx) or comma-separated values (.csv) files. This topic discusses preparing and importing this kind of data.
Preparing the Data
Before using Excel data with DataHub, it's important to understand it. Many Excel files are basically formatted reports. The raw data may have been annotated, aggregated, sorted, formatted, and grouped. Unfortunately, it can be difficult to extract meaningful data from this kind of file. In these cases, the data in the Excel file will need to be "massaged" before it can be used.
DataHub consumes only raw data. In order for an Excel file to be imported cleanly into DataHub, it must follow these three rules:
- The first row in a worksheet must only contain column header information.
- All subsequent rows must be completely filled with data in each column.
- Each worksheet in an Excel file is considered a different data object in DataHub.
The first two rules also apply to comma-separated values (CSV) data files for use with DataHub.
Cleaning Up the Data
Excel data to be loaded into DataHub should be "de-normalized", raw data. The worksheet should be edited to:
- Remove rows and cells used for annotation
- Remove aggregations (e.g. totals, averages, counts) from the rows and columns
- Remove compound header rows or spanned column headers
- Remove or fill empty or Null cells
- Provide any missing column headers
- Make data in a column homogeneous - don't mix text, numeric, or date values within a column
The following two images are examples of Excel files:
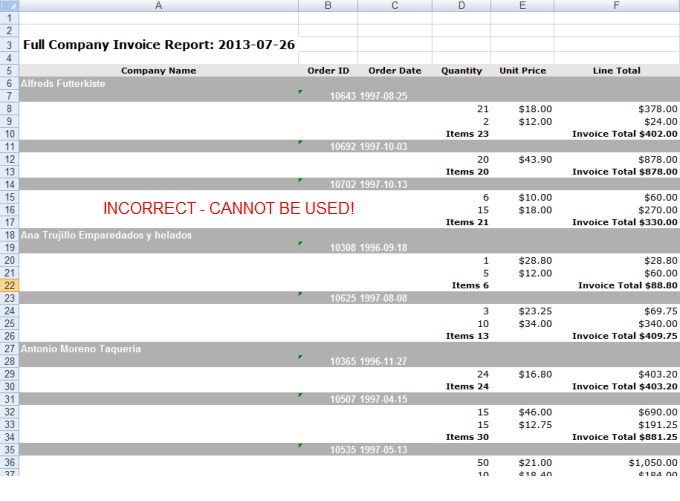
The incorrect example shown above is an Excel worksheet that cannot be used with DataHub. It violates many of the requirements previously outline.
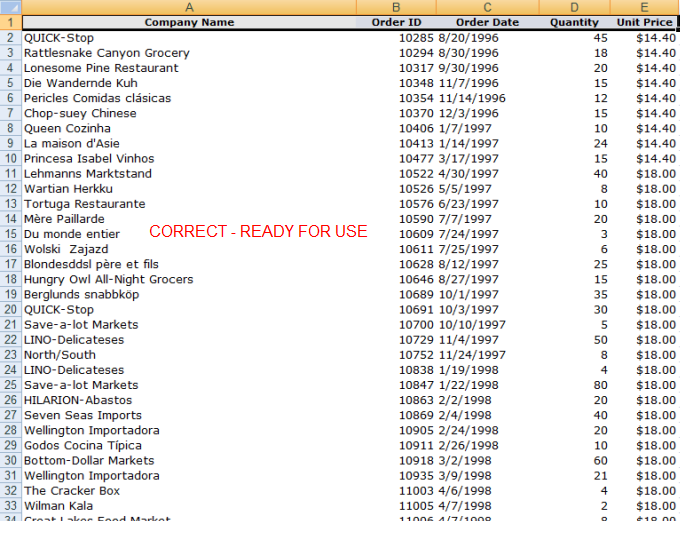
And now the same data is shown above after being cleaned-up for use with DataHub. Let's examine each of the clean-up steps in more detail.
Remove Annotations
Many Excel files contain annotations describing details of the data, such as its origin, when it was generated and by whom, copyright notices, disclaimers, etc. For analysis purposes, this information is generally useless. From the DataHub perspective, annotations should be removed so that they don't corrupt the data.

For example, the rows containing the title and date from the worksheet shown earlier should be removed.
Remove Aggregations
Since DataHub is expecting raw data, any aggregated data in a column in the worksheet would be incorrectly considered raw data. So, the aggregated data should be removed before uploading it to DataHub. If you compare the two example Excel worksheets shown earlier, you'll notice that the invoice aggregations, as well as the Line Total column, have been removed during the clean-up process.
Remove Multi-Row Column Headers
Excel allows you to create multi-column headers where the text spans multiple columns (this is not shown in the example images). These should be reduced to a single-column header in the first row. It may require a change in naming conventions for the column header.
For example, you may have 2015 and 2016 data broken into Revenue, Expense and Net columns. You may want to set the final column headers as 2015 Revenue, 2015 Expense, 2015 Net, 2016 Revenue, 2016 Expense, 2016 Net. A better choice might be to include a Year column and set the 2015/2016 data values and keep the Revenue, Expense, and Net columns.
Remove or Fill Empty or Null Cells
Empty cells and cells with Null values are considered data once imported into DataHub. For example, in the incorect example worksheet shown earlier, all of the cells that are subordinate to the grouped data are empty. These cells must be filled to correlate the data values to the proper group.
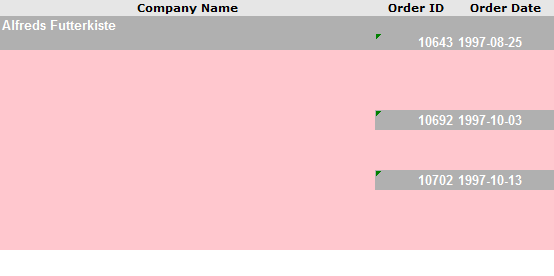
For example, the cells in pink shown above should be filled with their parent data. The Company Name should be filled all the way down, along with their respective Order ID and Order Date cells.
Provide Missing Column Headers
Every column must have header text. This text will be used to identify the column data in DataHub. After formatting your Excel worksheet, make sure that each column is properly identified in the first row of the worksheet.
Make the Data Homogeneous
Within each column, all data should be of one data type. DataHub examines the data during import and sets the data type (dimension, measure, date, identity) according to column contents, so it's important that all of the data be of the same type.
Excel worksheet column formatting can be tricky here. For example, in the worksheet shown earlier, the Order ID column appears to be numeric and would therefore be assumed to be a "measure" in DataHub. However, the Order ID is actually text data (as you can tell by the small, green triangle in the upper left corner of each Order ID cell) and would actually be imported into DataHub incorrectly as a "dimension".
Importing Multiple Worksheets
When an Excel file is identified in DataHub as a data source, each of the worksheets found in the Excel file will be presented as a different data object. Consider the following Excel file:
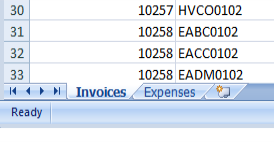
The file includes two worksheets, Invoices and Expenses.
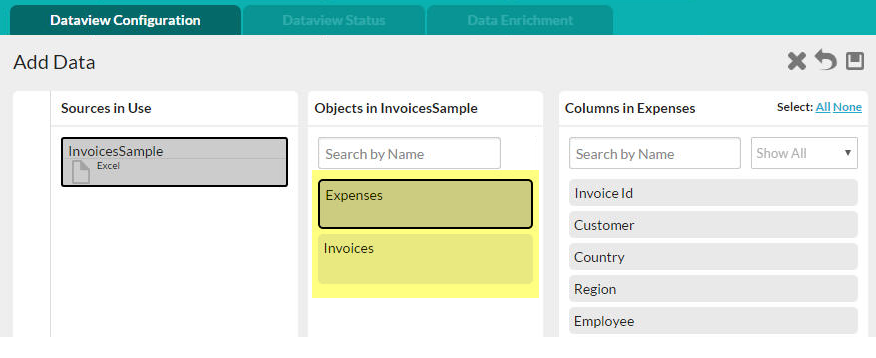
When imported into DataHub, they will be presented as two separate data objects, shown highlighted in yellow above.
Uploading Data Files
In DataHub's Create a New Dataview page, there are two tabs: From File and From Source.
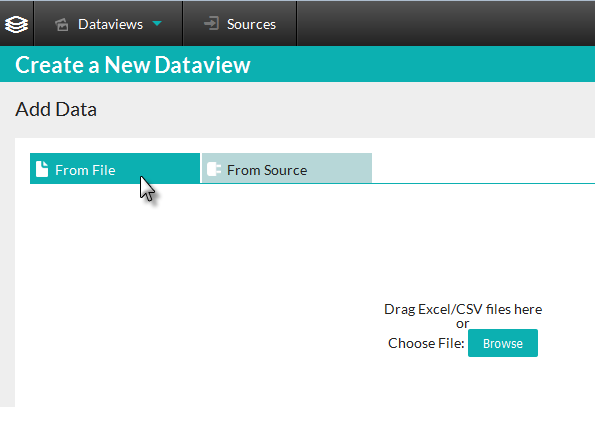
In the From File tab, a drop zone and Browse button are displayed. You can either drag-and-drop an Excel or CSV data file into the area, or browse to and select the desired file.
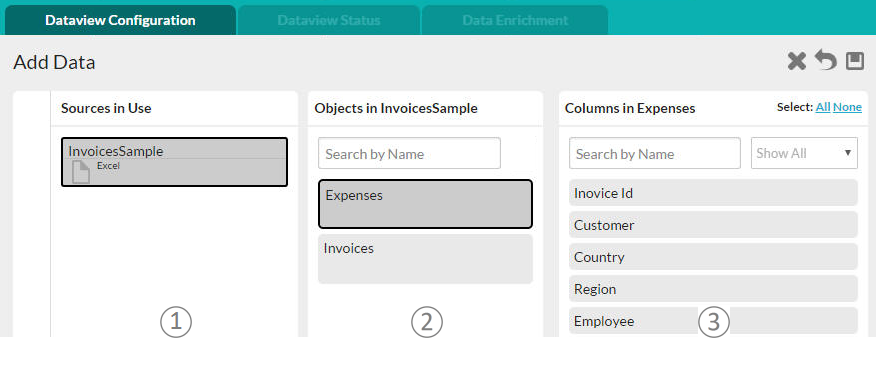
Once the file has been selected, you will be presented with a Dataview Configuration page that allows you to select the work sheets and columns to be included in the new Dataview for analysis.
- Sources in Use - This panel identifies all of the data sources being used in the current Dataview. In the example above, the Excel file called "InvoiceSample"
is the data source.
- Objects - This panel identifies all of the data objects created from the worksheets in the imported Excel file. Their names are the worksheet names.
The Excel file name will become the initial Dataview name once data configuration has been completed.
- Columns - This panel displays the data columns from the currently selected data object (worksheet). Click columns to include them in the dataview (or click the All link in the upper right-hand corner).
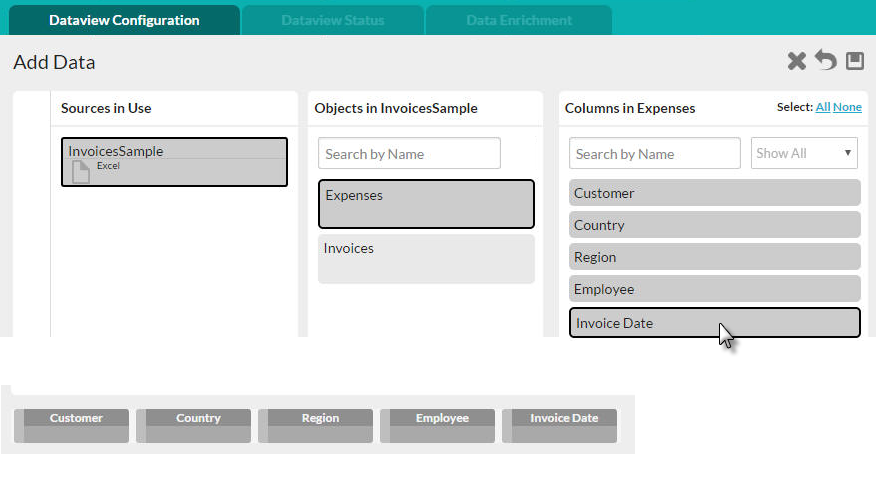
As you select columns, they'll be added to a row of "column pills" along the bottom of the page, as shown above.
Repeat the process if you need columns from a different data object or different source until your Dataview is complete. To remove a column previously selected, click it again in the Columns panel. Click None link to remove all of the columns related to the selected object.
Click the Save icon ![]() to save your Dataview and the data from the file will be loaded. During that process, the Dataview Status page will be displayed and an initial "sample" analysis table will be presented.
to save your Dataview and the data from the file will be loaded. During that process, the Dataview Status page will be displayed and an initial "sample" analysis table will be presented.
Click the Reset icon ![]() to start the column selection process over again, or click the Cancel icon
to start the column selection process over again, or click the Cancel icon ![]() to cancel the operation entirely.
to cancel the operation entirely.
![]() If you're having trouble importing a CSV file and you suspect that it may be due to special characters in the data, try opening the file in Excel first, saving it as an Excel file, and then importing the Excel file.
If you're having trouble importing a CSV file and you suspect that it may be due to special characters in the data, try opening the file in Excel first, saving it as an Excel file, and then importing the Excel file.
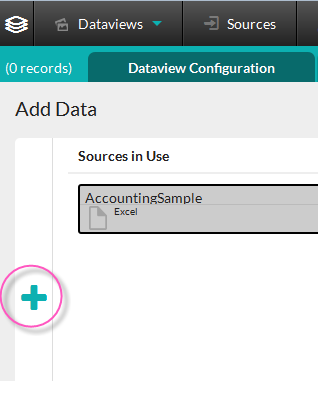
DataHub allows you to blend data from multiple, disparate data sources. This can be done by clicking the Add Data icon, circled above. Your current data sources will appear in a panel on the right and a new Add Data panel will open on the left. Click the appropriate tab to begin the data selection process again. Click the icon (now shown as a minus "-" sign) again to close the panels.