Logi Info v14.0 Enhancements
This topic introduces the significant features of Logi Info in this release:
- Bookmark Validation Utility
- AG - Zoom Charts
- AG - Aggregate Filters
- AG - Aggregate and Group Formulas
- AG - Add/Remove Extra Crosstab Label Column
- AG - Additional Series
- API Call
- Data Table Bookmarks - Save Sort and Column Order
- Crosstab Grouping and Summary
- Scheduler Time Zone Support
- Disable Metadata Check at Runtime
- DMF Conditional Attribute
- Input Date Highlight
- HTML Attribute Params
- What's Fixed?
Bookmark Validation Utility
The Bookmark Validation tool helps validate the integrity of existing bookmarks after making metadata changes to proactively identify and react to any errors that arise due to these changes. Metadata changes include (but are not limited to) renaming or removing a column, updating data type, and adding aggregate tables.
This independent tool is available for both Java and .NET and designed to run in command line/console. This application uses two required arguments and two optional arguments, described below:
| Argument Name | Output Value |
|
-s:<folder> |
Use to set your application folder path. |
|
-f:<file |
Use to set the output report file path and file name |
| -m:[all|basic] | Use to set the Check All or only USED columns. This is optional and the default is 'all'. |
| -ol:[all|error] |
Use to set the output level. This is optional and the default is 'all'. If set to 'error', only the error messages are included in the results file; anything that has passed will not be included. |


If you are an existing user, you can access a download link to the zip folder for the .NET version here and the Java version here. If you are a new user, you automatically receive the bookmark validation tool in your BIN folder when you install Info v14.0. You can run this directly from the folder, but you must specify application path, where the bookmark is stored, and what kind of error you are looking for.
For more information, see InfoGo - Bookmark Validation.
Output Formatting
The format for the output content makes it easy to understand the results file and determine changes that need to be made to your bookmark or metadata. Below is an example of a results file showing the Bookmark Name, Bookmark Type, Column, Visualization Type, and Error:
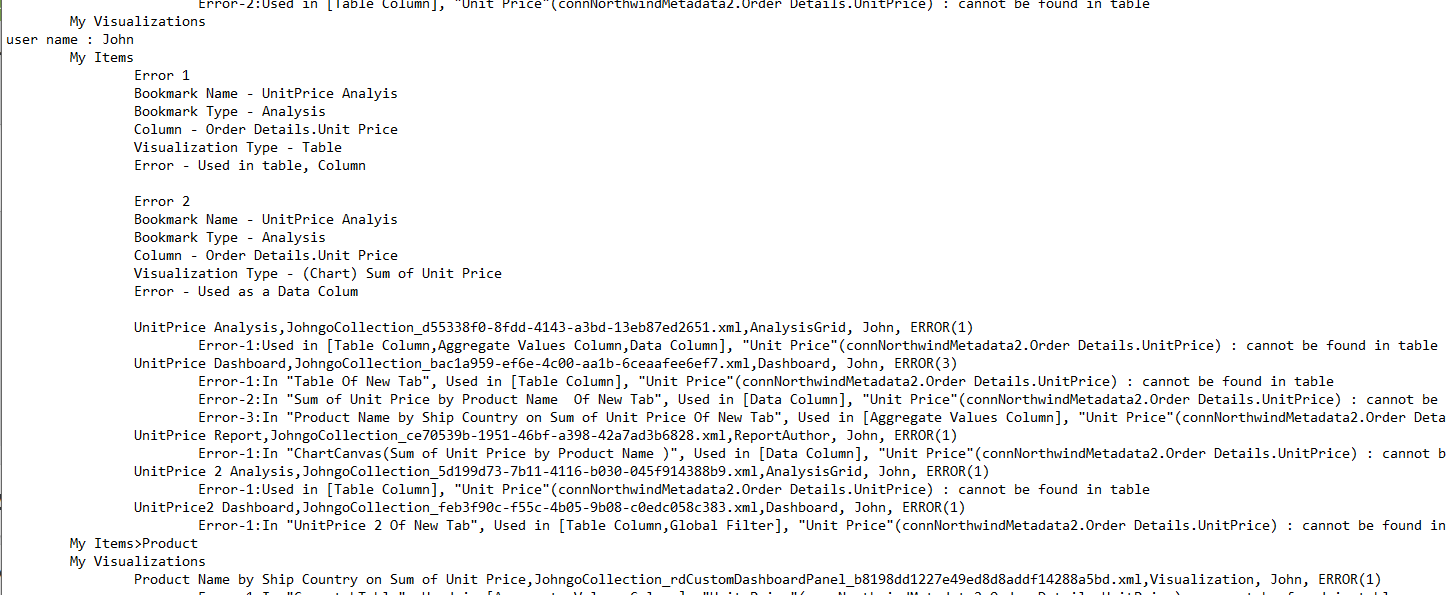
For more information about how to generate this result file, see InfoGo - Bookmark Validation.
AG - Zoom Charts
You can now use a new constant, ChartAutoZoom, to enable zoom control in your existing SSRM implementation with Analysis Charts, Dashboard Author, and Report Author. This constant enables/disables zoom filtering on Bar Charts, Line Charts, Curve Lines, and Scatter Plots. To enable Zoom control, set the ChartAutoZoom constant to "True".
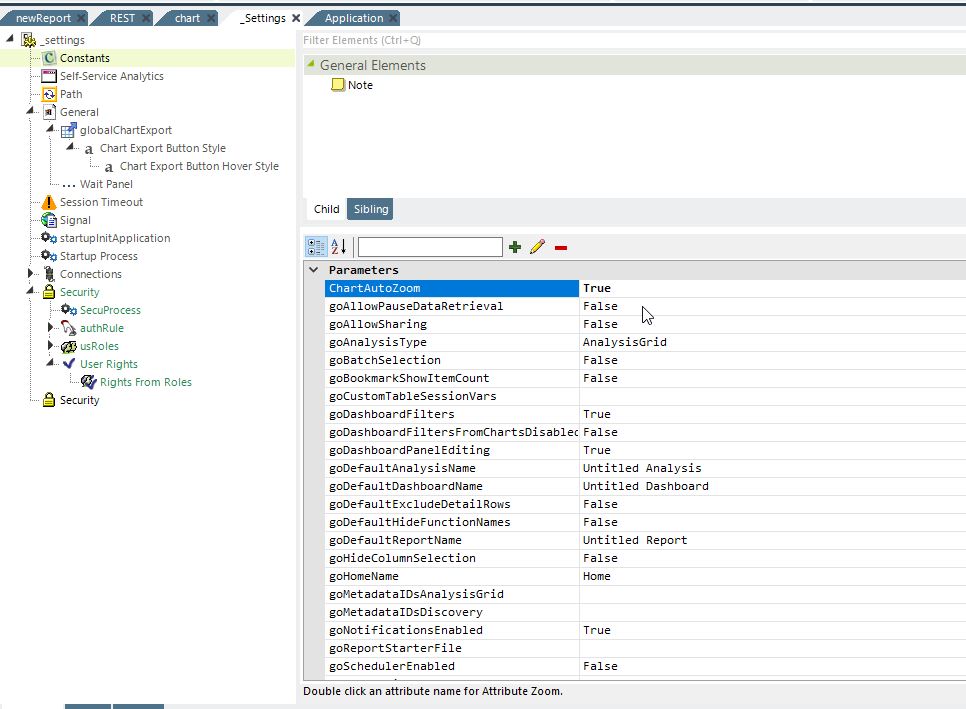
For information about configuring the "ChartAutoZoom" constant, see Configuring InfoGo Constants.
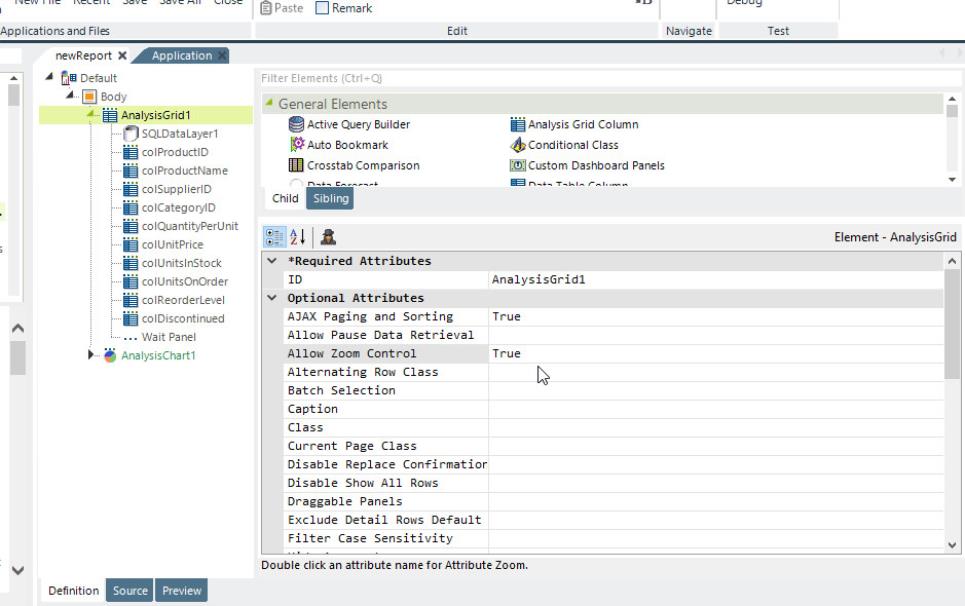
For non-InfoGo (Managed Environment) purposes, the attribute "Allow Zoom Control" enables/disables Zoom Control in the Analysis Grid. By default, this attribute is "False". Set to "True" to enable the Zoom Control feature.
![]() The Zoom control does not work if Range InputSelection is in use.
The Zoom control does not work if Range InputSelection is in use.
For information about configuring the "Allow Zoom Control" attribute, see Analysis Grid Developers - Controlling Feature Access.
AG - Aggregate Filters
You can now apply filters on aggregates in your Analysis Grid. Prior to this enhancement, if you wanted to apply a filter to your Analysis Grid, you could only choose a column or field that was available in the Filter Column drop-down menu, which did not include aggregate values. This feature is only supported on the following database versions:
- MySQL > = 8
- SQLServer > = 2005
- Oracle > = 9
- PostegreSQL > = 8
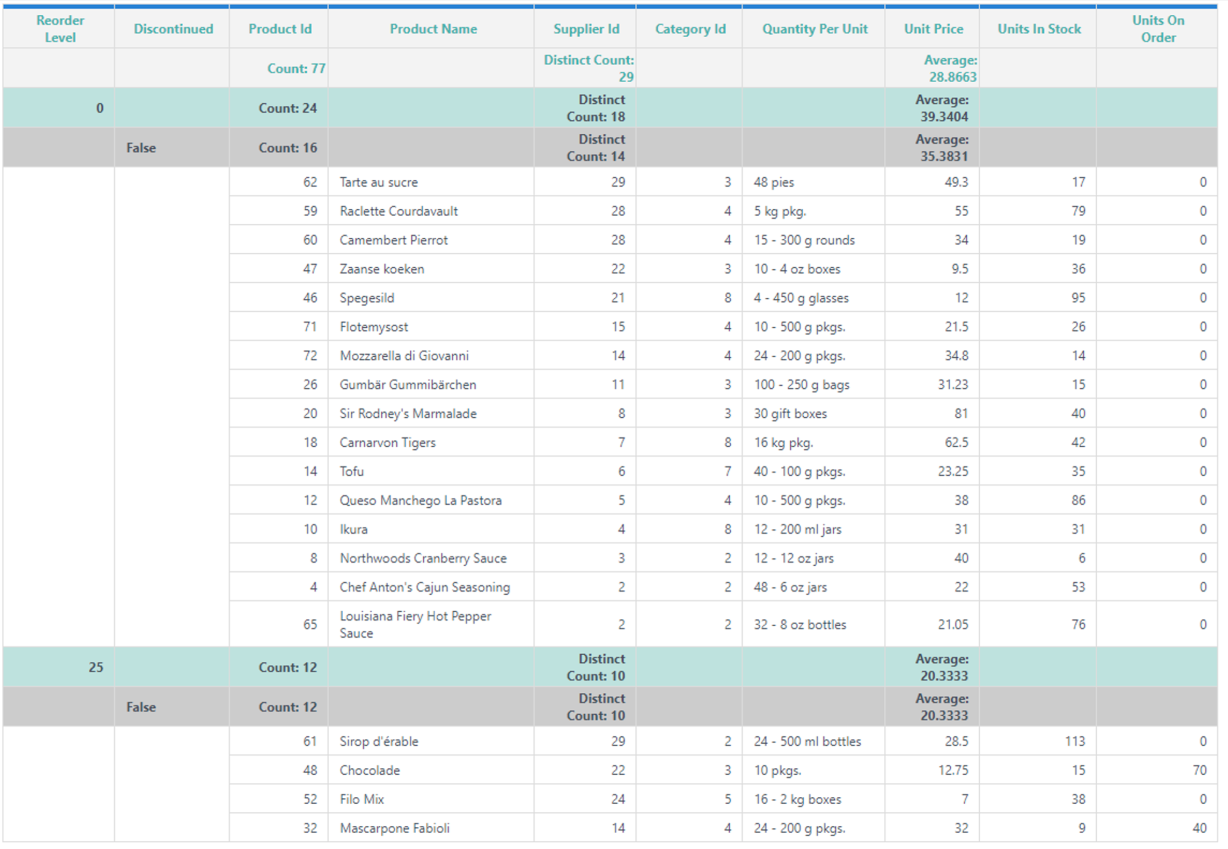
In the example below we grouped the columns Reorder Level and Discontinued. Then, we applied an aggregate of Count on the Product Id column, Discount on the Supplier Id column, and Average on the Unit Price column:
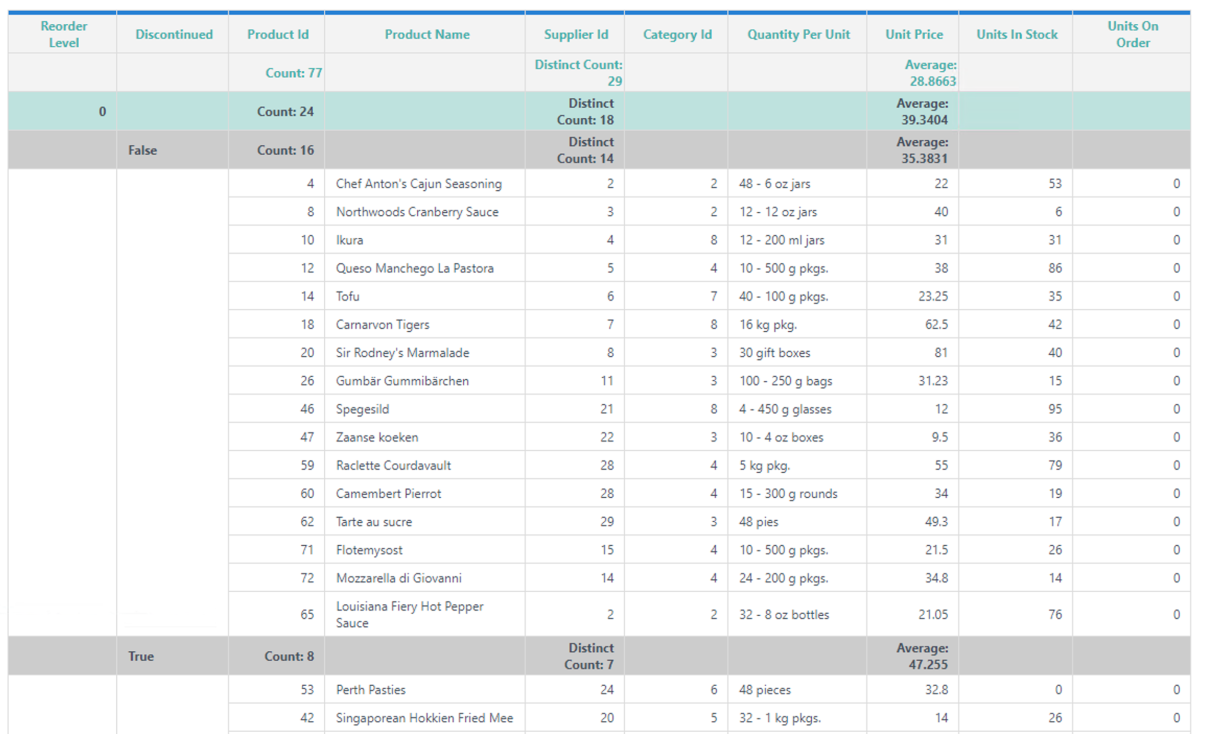
With this enhancement, you can narrow down the results of an aggregated column by applying a filter on the aggregate. In this example, we want to apply an aggregate filter that distinguishes any Count over 10.
To access the new feature, select the Aggregate tab and then select the filter icon:
![]()
Select a Filter Column, add a Comparison, and enter a Value. Then, select Add.
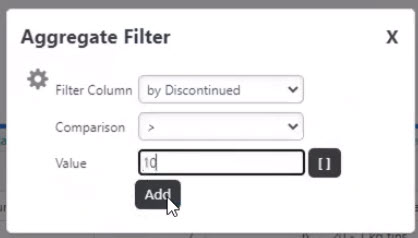
Now, our Analysis Grid displays Count values over 10 for the Product Id column:
For more information, see Analysis Grid - Filtering Rows.
AG - Aggregate and Group Formulas
You can now use aggregates and group functions in formulas in your Analysis Grid. This enhancement enables self-service users to analyze data based on high-level calculations, instead of relying on individual values. Prior to this enhancement, you could not calculate the percentage and the number value could only be calculated inside the table. Now, if you add an aggregate function to the formula, you can automatically calculate the second value and have it display in your table.
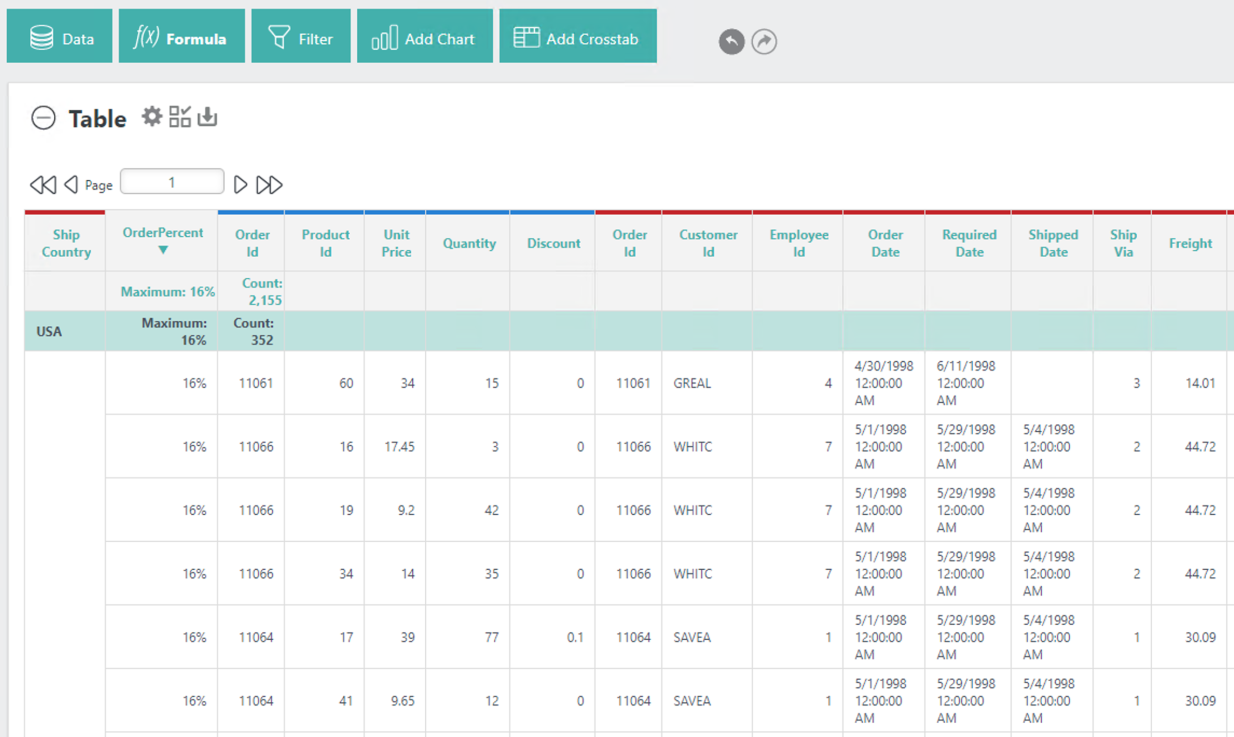
Below is an example of the new formulas, over(partition BY [xxxxxx]), used to display the two order counts:

In the example below, there are two values that demonstrate the two-level order count for the Order Id. The first row includes the global order count, while the second row specifies the order count for that country. These values are shown as both a number and a percentage:
For more information about aggregations and formulas, see Analysis Grid - Adding Formula Columns.
AG - Add/Remove Extra Crosstab Label Column
You now have the ability to add or remove Extra Label Columns to a Crosstab Table in your Analysis Grid.
To utilize this feature, select the Extra Label Column drop-down menu:
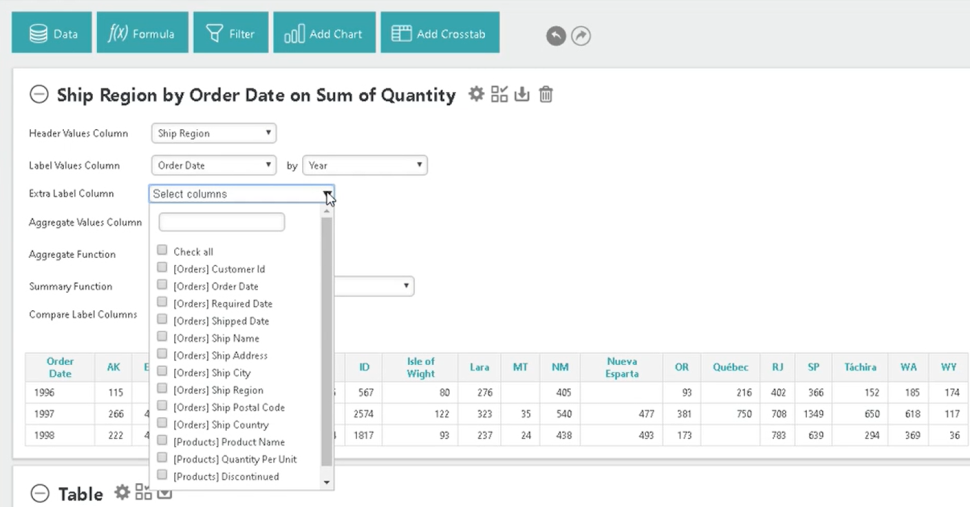
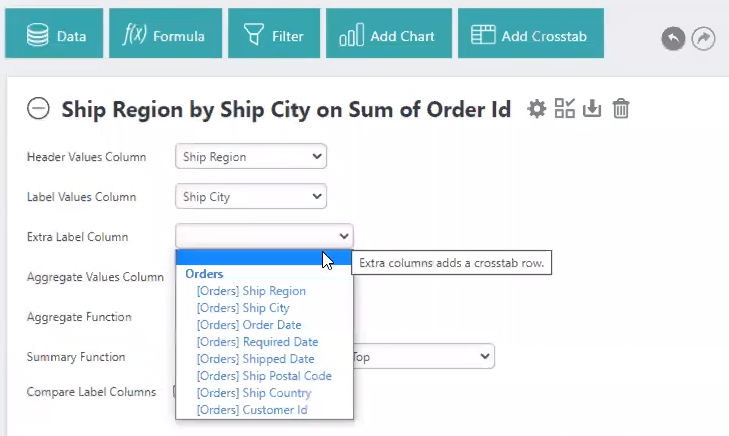
Add Extra Label Columns by selecting options in the drop-down. In the example below we've selected the Ship Name Ship Region and Ship Address Ship City columns:
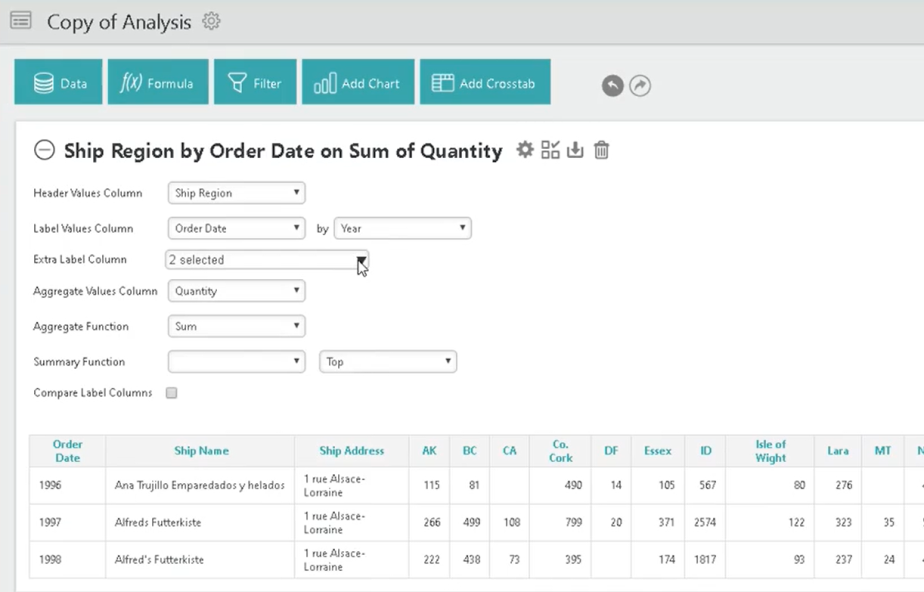
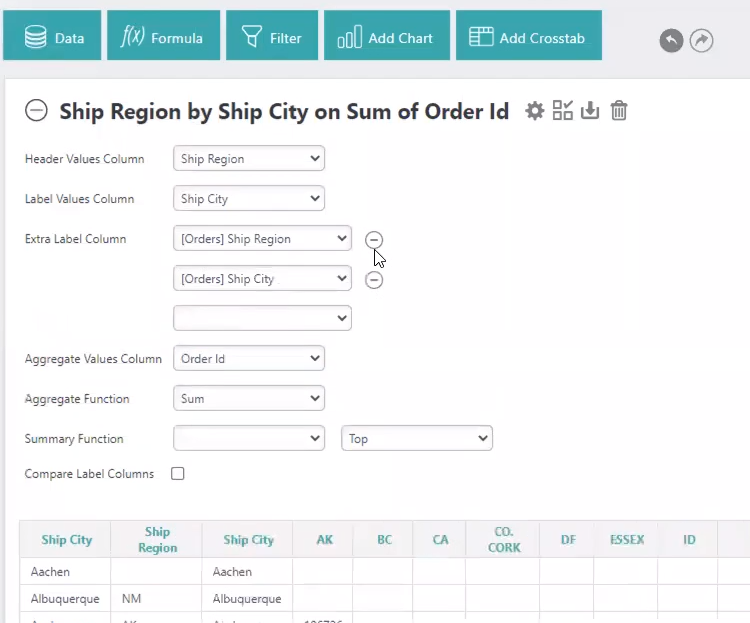
To remove Extra Label Columns, select the - icon next to the Extra Label Column field. Extra Label Column drop-down menu and uncheck the desired columns in the list. The order in which the columns appear in your Analysis Grid are as follows: Label Column, Extra Label Column, and Header Columns. However, you can still drag columns to manually alter the order in which these columns display in your Analysis Grid.
![]() Extra Crosstab Label Columns are for display only and do not support grouping.
Extra Crosstab Label Columns are for display only and do not support grouping.
For more information, see Working with the Crosstab Filter.
AG - Additional Series
You now have the ability to add or remove additional series from your Analysis Grid charts for visual comparison. Prior to this enhancement, you could only add one additional column to your Analysis Grid. Now, you can add multiple series to your Bar, Line, Curved Line, and Scatter Plot chart types.
To add an additional column to your chart, select the Additional Column drop-down menu:
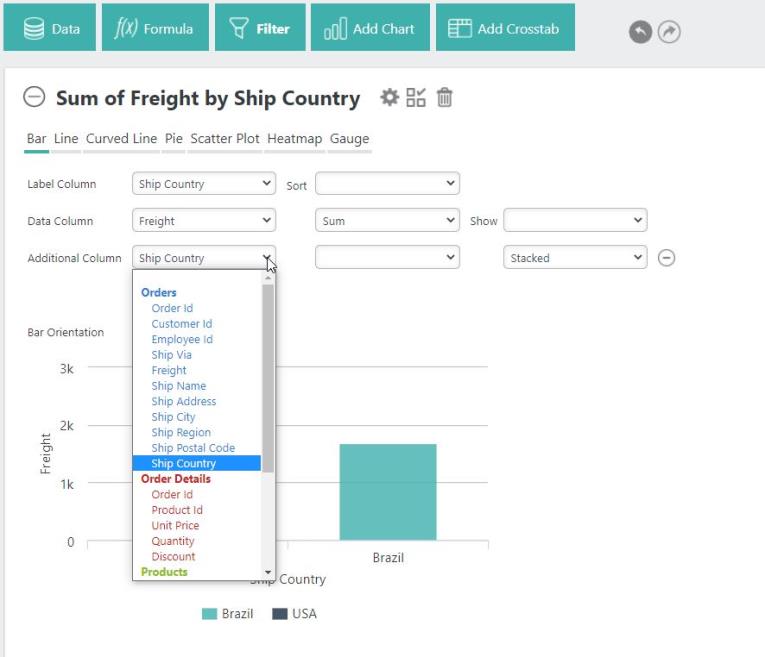
Then, select the column you want to add. Repeat these steps to add multiple additional columns.
Depending on the chart type, other controls will appear for use configuring additional series, including aggregation options and charting types. These controls allow you to choose between Stacked, Stacked Percentage, and Side By Side. Aggregation options include Count, Sum, or Distinct Count. Additional options for charts include Bar, Line, Curved Line, and Scatter Plot and Dual Axes or Single Axis graphs.
Remove the additional column(s) by selecting the - icon:
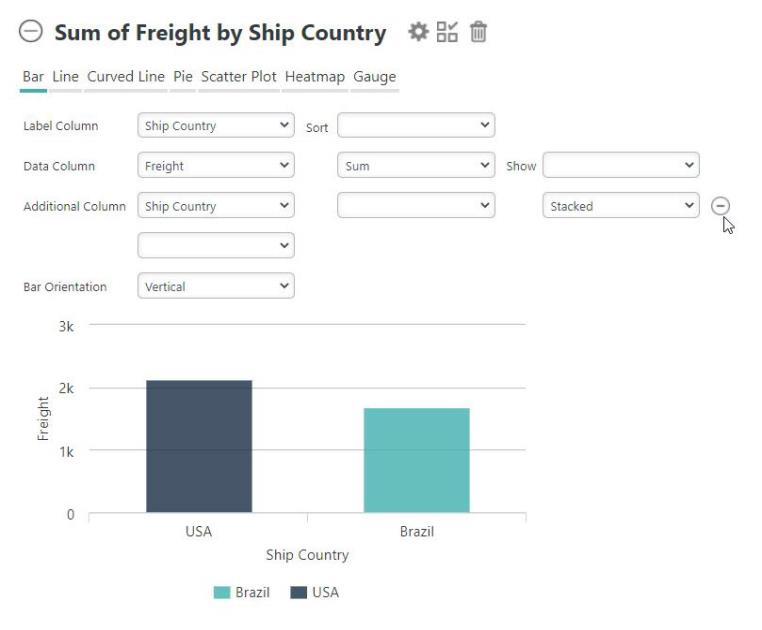
![]() If you only have one additional column, selecting the blank option at the top of the Additional Column drop-down menu will also remove the additional column.
If you only have one additional column, selecting the blank option at the top of the Additional Column drop-down menu will also remove the additional column.
For more information, see Analysis Chart - Adding Additional Series.
API Call
It is now easier to handle multi-step API calls. This enhancement is useful when making an API call to get an authorization token and then passing the result of the API call number into the Authorization Header of an API endpoint. After calling a Procedure.REST, prior to these changes, there were two procedure tokens available for subsequent procedures to use, @Procedure.myProcedureID.rdHttpResponseCode~ and @Procedure.myProcedureID.rdHttpResponseDescription~. With this enhancement, you have the option to use the two former procedure tokens, in addition to one for each response header value returned from the REST call.
Additionally, the RequestHeader element was added as a child element of Metadata in your _Settings file, enabling you to use authentication to access the metadata URL identified in your Metadata element. Use this connection element by nesting your Metadata element and nesting the RequestHeader element.
See the example below for reference:
<Connection ID="SQL2016" SqlServer="192.168.193.38" SqlServerDatabase="NorthwindQA" SqlServerPassword="LGXpass" SqlServerUser="sa" Type="SqlServer">
<Metadata ID="SQL2016Metadata" MetadataName="SQL2016 Metadata" MetadataUrl="http://devwin2019:81/LogiInfoMetadata?id=SQL2016Metadata">
<RequestHeader RequestHeaderName="LogiRequiredKey" RequestHeaderValue="SecretCode" />
</Metadata>
</Connection>
Security Element
Along with this enhancement, you can call any Process Task before security is determined, enabling the Process Task to be used as a part of determining the Security Authentication. Prior to this enhancement, if you wanted to make an API call using REST, you had to provide login credentials to authenticate the user at login time. Now, you have the option to separate these two processes and send the API call without the security check.
A new child element, SecurityProcess, is now available in the Security element:
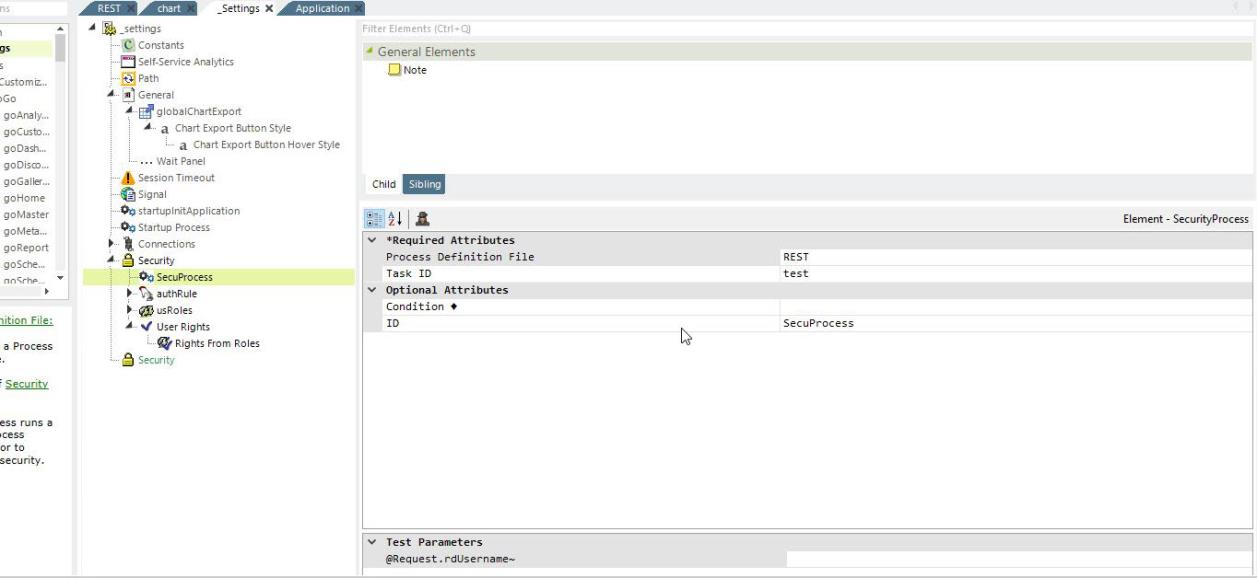
Set the Session Variable in the procedure and add a Condition Filter under the Authentication element in the _Settings file:
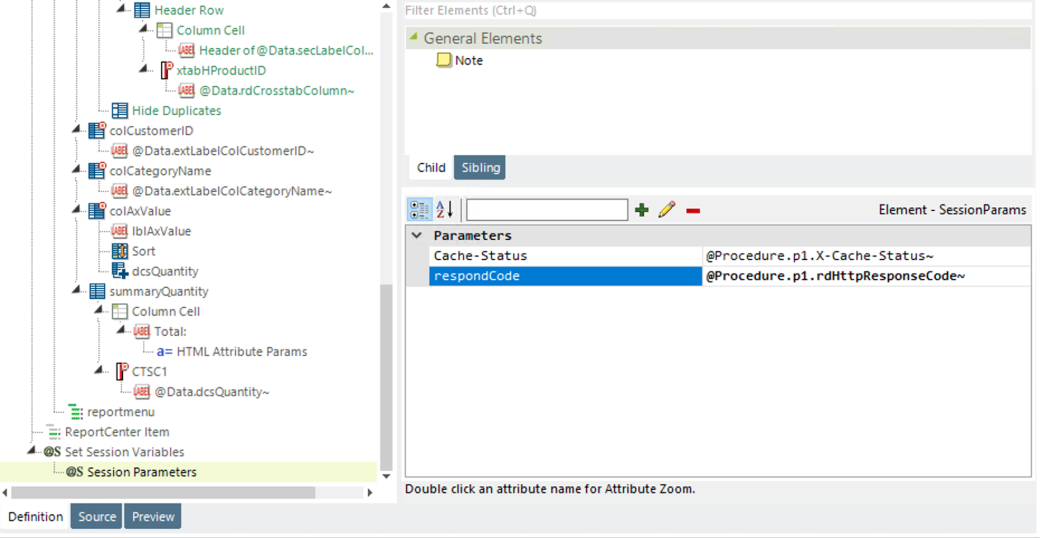
In our example, we used X-Cache-Status as the Session Variable in the REST process; but you can use whichever Session Variable or token fits your needs.
The Condition Filter checks whether the input username equals the session variable Cache Status; if not, the authentication will not pass.
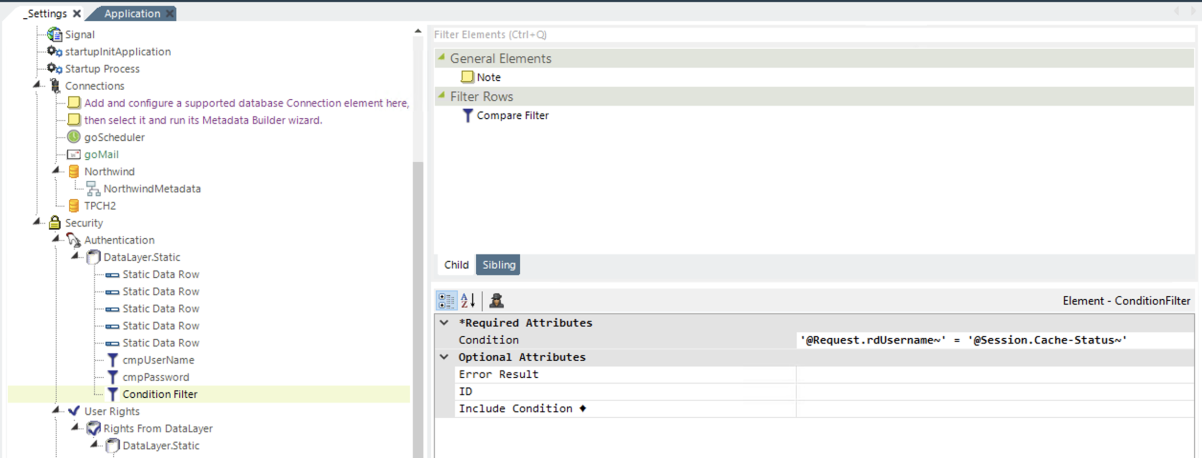
The SecurityProcess element works exactly like the StartupProcess, except for where it is placed and when it runs. It is placed in the _Settings.lgx file as a child of the Security element, and it runs when the Security element is being processed.
Using these two new features together enables you to leverage response headers from a REST call to aid in authenticating a user at login time. For more information, see Calling and Completing a Task.
Request Header for Metadata URL
Additionally, the RequestHeader element is now a child element of Metadata in your _Settings file, enabling you to use authentication to access the metadata URL identified in your Metadata element.
Data Table Bookmarks - Save Sort and Column Order
Report authors now have the option to enable the "remember sort and column order" function in a Data Table so these changes can be stored in bookmarks. Previously, these adjustments were only stored during sessions and you were unable to access the saved settings in future instances. The session variables associated with Data Table sorting and column dragging are now saved in the bookmark, and also updated in the bookmark, as changes are made to sorting and column dragging in the browser. This feature must be enabled, by default, the attribute is set to "False". To enable this feature, set the "Remember Sort" attribute to "True". Note that if you are using Studio, the Wizard will set this attribute to "True" for you. By setting the "Draggable Columns" attribute to "True", the Data Table columns can be moved and the column order can be changed (saved) in bookmark, and retrieved.
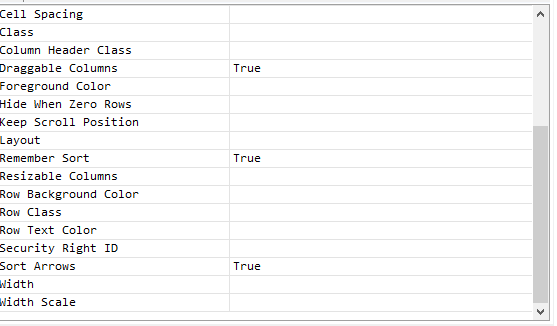
For more information, see Creating a Data Table Manually.
Crosstab Grouping and Summary
You now have the ability to add Group Headers and Summary to your Crosstab Tables. Prior to this enhancement, you had to use a table with repeat elements to simulate a similar functionality. Now, you can group value columns and label columns by adding the new Secondary Label Column to your Crosstab Filter. The Secondary Crosstab Label Column element is a new attribute that acts like the Extra Crosstab Label Column, but it allows the columns to be grouped.
Below is a before and after example of the Crosstab grouping feature:

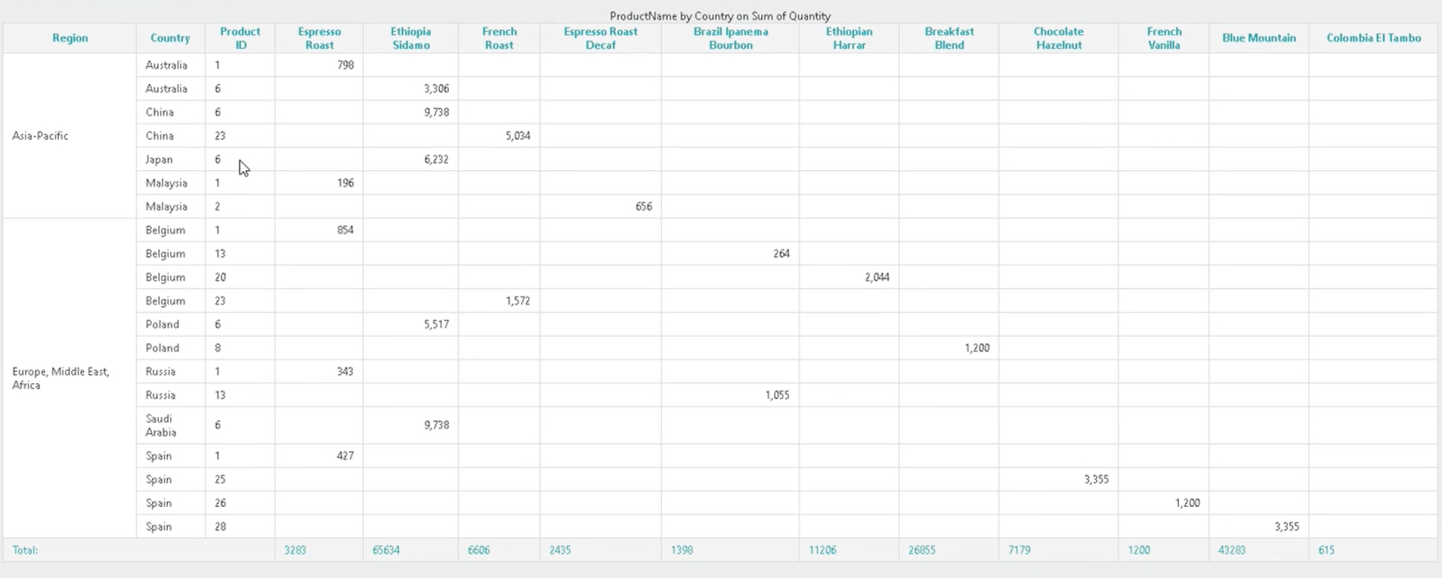
For more information, see the Crosstab Grouping section in Applying the Crosstab Filter to a Crosstab Table.
Crosstab Summary
After you apply a Crosstab Filter, you can add Header Rows and Summary Rows to total the Data Columns you have grouped together.
Summary Rows
Begin by adding a Summary Row element to your Secondary Crosstab Label Columns. In this example, we're adding a Summary Row to the "colCountry" Secondary Crosstab Label Column and giving it the ID "summaryRowCountry":
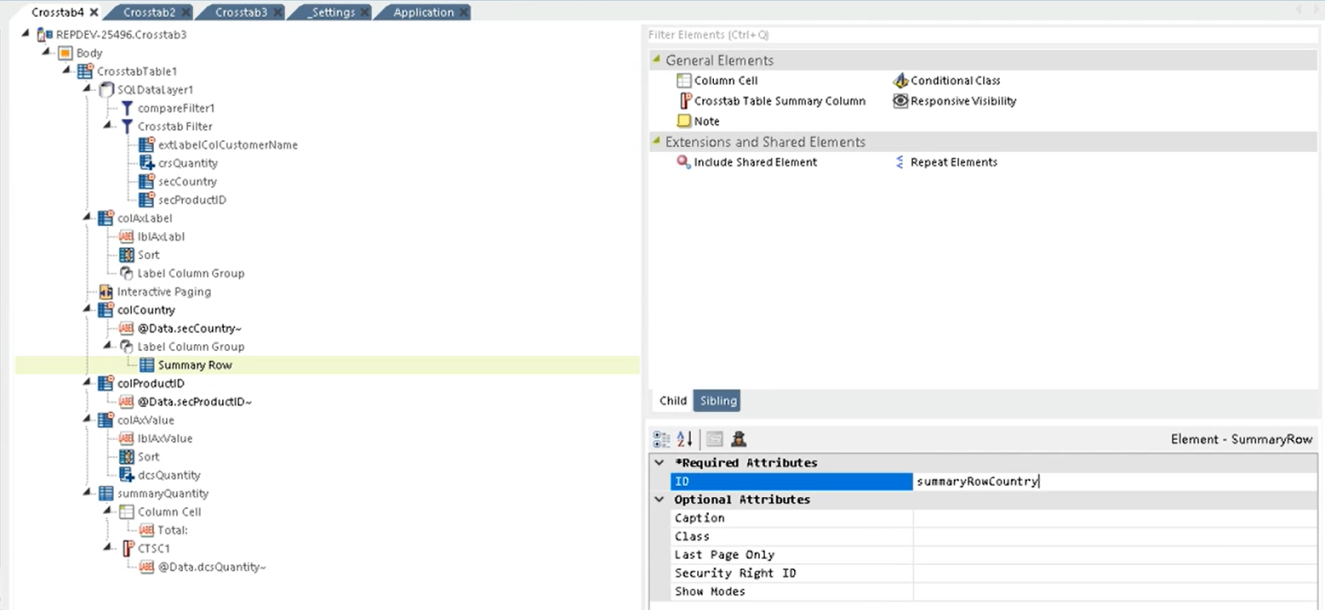
Save and refresh your report. Info displays the Crosstab Table with a Summary Row for the Country column:

You can further customize your Summary Row by adjusting the Column Span and adding a Crosstab Table Summary Column. For additional instructions, see the Crosstab Summary section in Applying the Crosstab Filter to a Crosstab Table.
Header Rows
Add a Header Row element beneath your Label Column Group element and give it an ID:
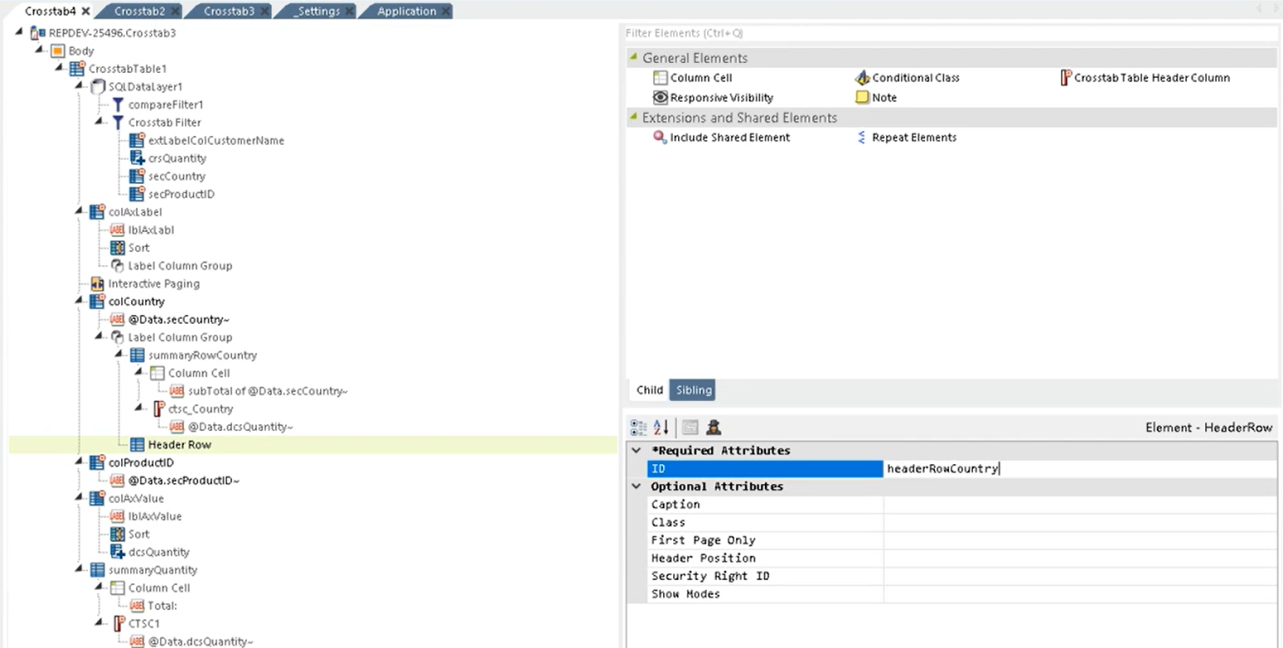
Save and refresh your report. Info displays the Crosstab Table with the new Header Row:
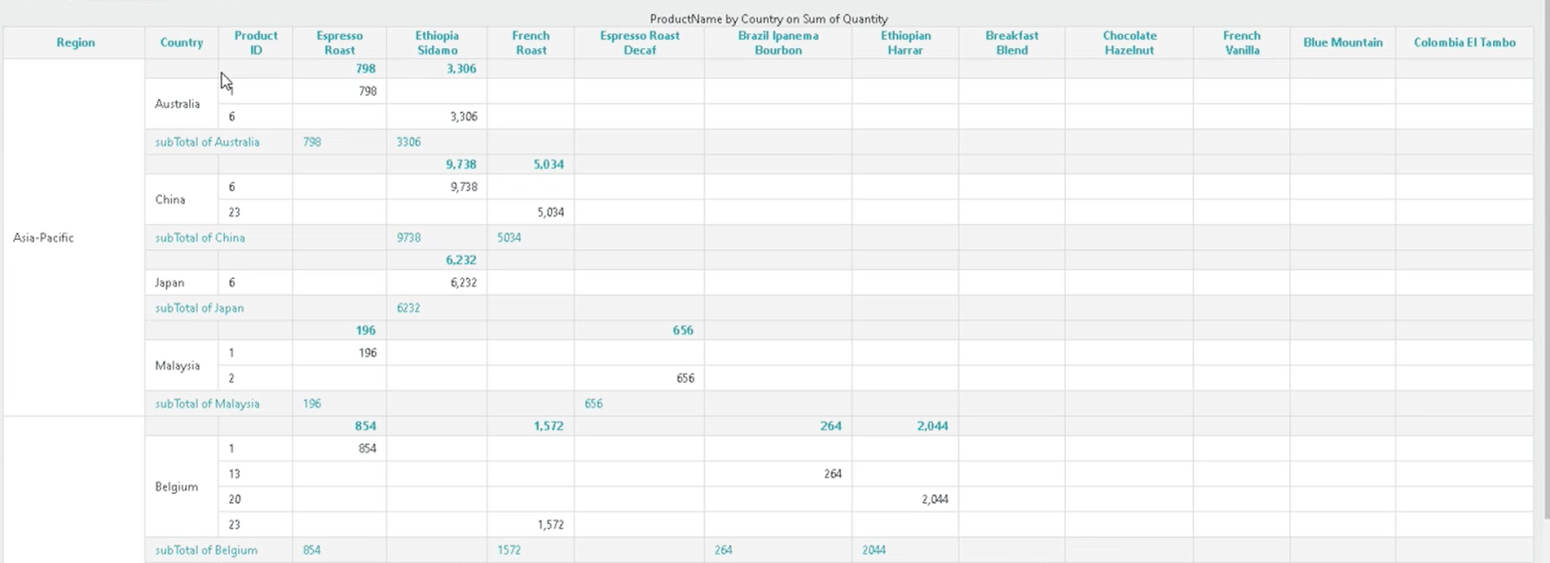
You can further customize your Header Row by adjusting the Column Span and adding a Crosstab Table Header Column. For additional instructions, see the Crosstab Summary section in Applying the Crosstab Filter to a Crosstab Table.
Scheduler Time Zone Support
You now have the option to provide a time zone for scheduled tasks. Prior to this enhancement, you had to manually configure the time difference based on the server location. Now, you can utilize the Time Zone drop-down menu when scheduling a task to target time zones. This feature is backward compatible and available in both .NET and Java environments. The default value for the time zone is blank and the service time zone is the same as the current status. If you upgraded to the latest version, you'll see a blank time zone for the scheduled task. Note that the existing time zone will not change unless you edit it.
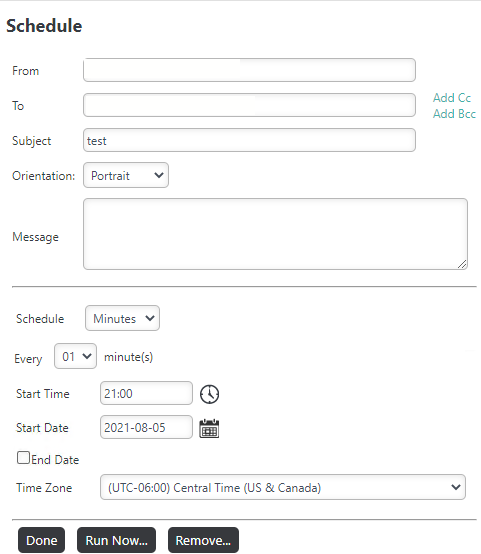
Once you schedule the task, the clock icon turns green and the tooltip displays the time scheduled for the task.

Change the time zone at any time by selecting the clock icon.
The following columns were added to the DataLayer.Scheduler to support this new feature: TimezoneTimeLastRun, TimezoneTimeNextRun, and TimezoneName. If there is no time zone, the TimezoneLastRun and TimezoneNextRun columns default to TimeLastRun and TimeNextRun, respectively. The display name of TimeZoneInfo is now @Data.TimeZoneName~.
For more information, see InfoGo - Reporting Scheduling Details.
Disable Metadata Check at Runtime
The constant, rdDisableMetadataColumnCheck, was expanded to give you the option to disable the metadata check at runtime and use what is already in the bookmark. Setting this constant to "True" allows access to bookmarks that reference columns not defined in the metadata source file. While this constant is "True", if you edit the metadata and add or remove Security Right IDs at runtime, those Security Right IDs will be ignored for existing bookmarks. Note that when this feature is enabled bookmarks only use the metadata as it existed when it was created, with the exception of the Data tab because that is where the metadata, tables, and columns are selected or changed, and the metadata stored in the bookmark only contains the tables and columns that have already been selected. If a table or column is missing from the metadata it will still appear as selected on the Data tab for that bookmark, and it will also show any newly added tables and columns from the live metadata so that more tables and columns can be selected.
If this constant is not defined, or set to "False", the behavior will continue as expected, and check the metadata at runtime. If this constant is not set and a column or table is missing from the metadata, the Visible check box is not selected, or the Security Right ID is not granted to the user, then you will receive a "missing table or column" error.
DMF Conditional Attribute
The Definition Modifier File (DMF) element now includes a condition attribute that enables loading of the DMF. Previously, a request token was required in the DMF element filename attribute to complete this process. By default, this attribute is set to "True".

![]()
- If this attribute is not set, set to an empty string, or set to "1", it is considered "True".
-
Tokens can be used here to provide the DMF filename (as shown above), which allows you to specify different DMFs (or no DMF) for different situations, users, etc.
For more information, see The Definition Modifier File Element.
Input Date Highlight
The Date Picker for an Input Date element now highlights both today's date (default), and the selected date:
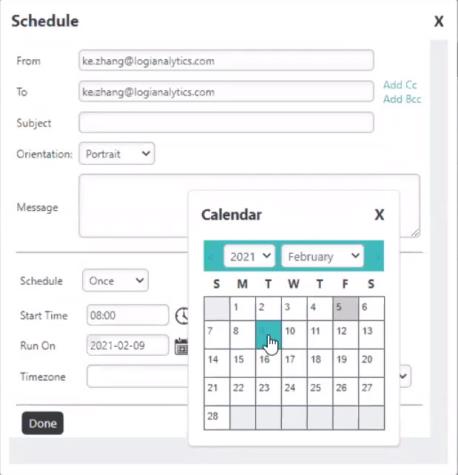
Note that these highlights differ in style, with the selected date highlighted and the current date grayed out.
For more information, see Input Date.
HTML Attribute Params
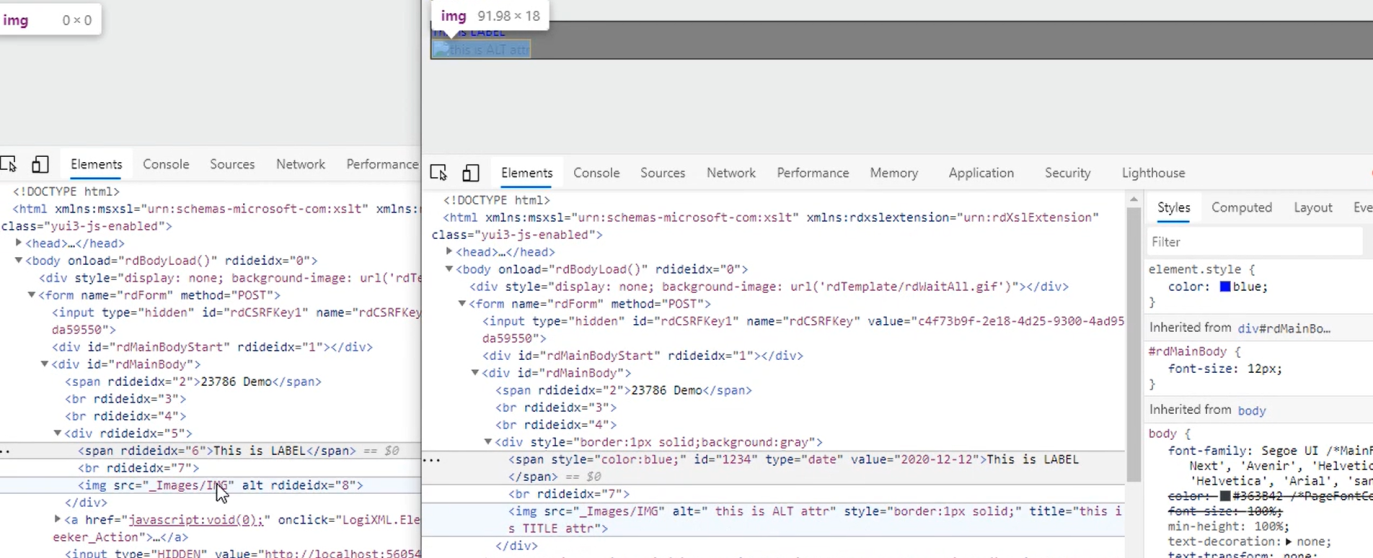
As a report developer, you can now add "HTML Attribute Params" to other HTML-like elements (Image, Label, Division), so you can apply your application to work with other frameworks or libraries easier. Depending on the element you add the HTML Attribute Params to, there are additional parameters for you to specify. For example, the IMG element includes "alt", "style", and "title" parameters:
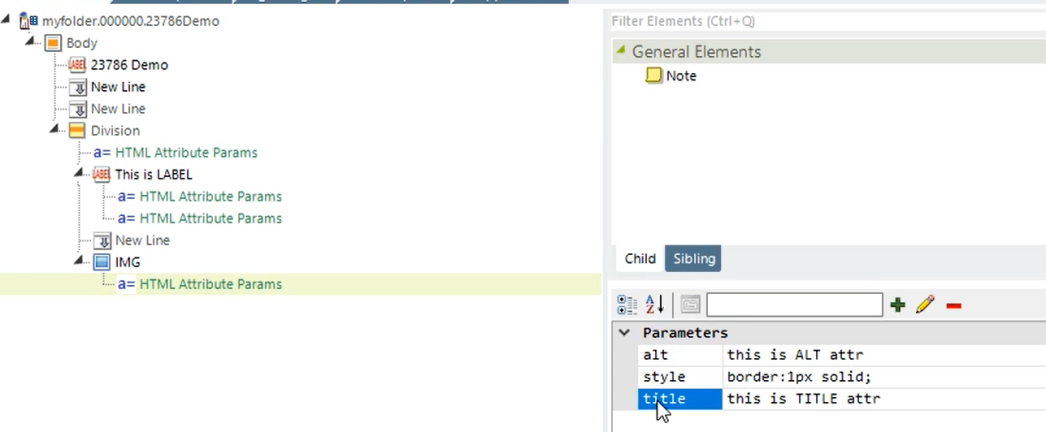
HTML Attribute Params added to Division elements include "style" parameters and Label elements include "Id", "type", and "value" parameters.
After applying the HTML Attribute Params, the source code looks like the following:
![]() If an attribute was set in both Element and HTML attribute params, the one set in the HTML attribute params will be ignored.
If an attribute was set in both Element and HTML attribute params, the one set in the HTML attribute params will be ignored.
For more information, see Conditions Example: Using the Division Element, Tooltip Panel Element, or Using the Label Element with HTML Format.
What's Fixed?
For information on bug fixes, please see this page.
AG - ActiveSQL with PostgreSQL
Aggregate queries no longer time out when using PostGres and performing sum, then calculating aggregates on formula columns.