Analysis Grid - Adding Formula Columns
Click the Formula tab or button to use the feature that allows you to add calculated columns
to the data:
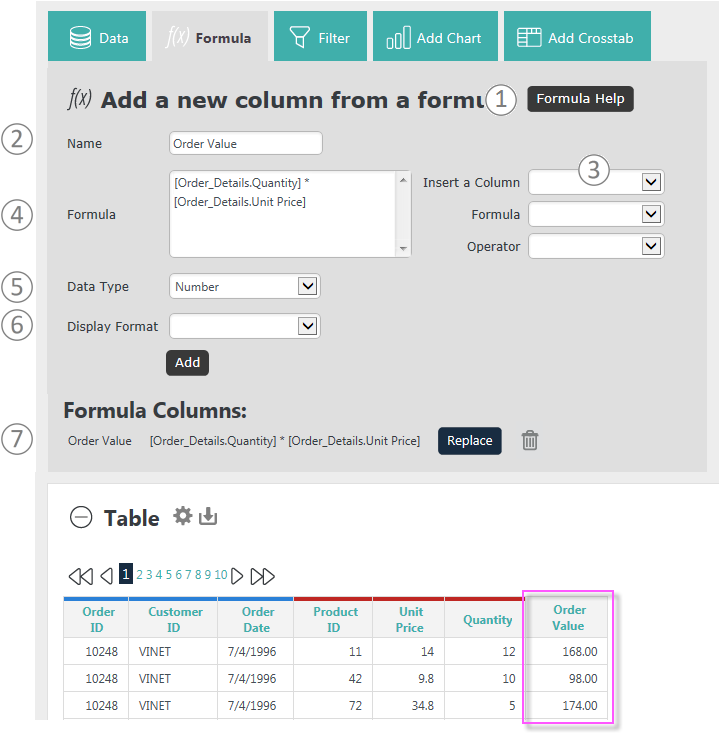
New columns are added at the right side of the table but can be relocated by dragging them. Here's how to use this feature:
- Help constructing a formula is available via the Formula Help button. The Formula Help pages have been relocated; if you created a browser bookmark for them, you'll need to update it.
- Enter the Name for the column that will be added to the table.
- Insert column names, functions, and operators into the Formula box by selecting them here.
- And/or enter the formula by typing it into the Formula box. Column names should be enclosed within square brackets [ ] and typical math operator symbols, such as + - * / should be used. You can always edit or delete anything in this space.
You can enter formulas that don't contain data columns. You can also add an aggregate functions into the formula. - Specify the Data Type for the new column.
- Specify a Display Format. Formatting options include numeric and date formats. Click Add to create the new column and refresh the table.
- As Formula Columns are created, they're added to the Formula Columns list. Use the adjacent Replace button and Remove (trash can) icon to manage the list. Columns that have been added are now included in the list of available columns (3) for use in other formulae.
- Select the Formula tab or button to hide the controls when done.
Your application developer will have to advise you concerning which function set is valid in the Formula box. These can vary depending on the way in which data is retrieved from the data source. In once case, JavaScript-style functions can be used, but in another case only functions supported by the database server itself can be used. The help shown when you click the Formula Help button will provide useful information depending on the data source.
![]() To prevent creation of unmanageable tables, numeric type Formula columns are not available for use in a Crosstab Table as the Header Values Column or the Label Values Column.
To prevent creation of unmanageable tables, numeric type Formula columns are not available for use in a Crosstab Table as the Header Values Column or the Label Values Column.
Adding Aggregate and Group Formulas
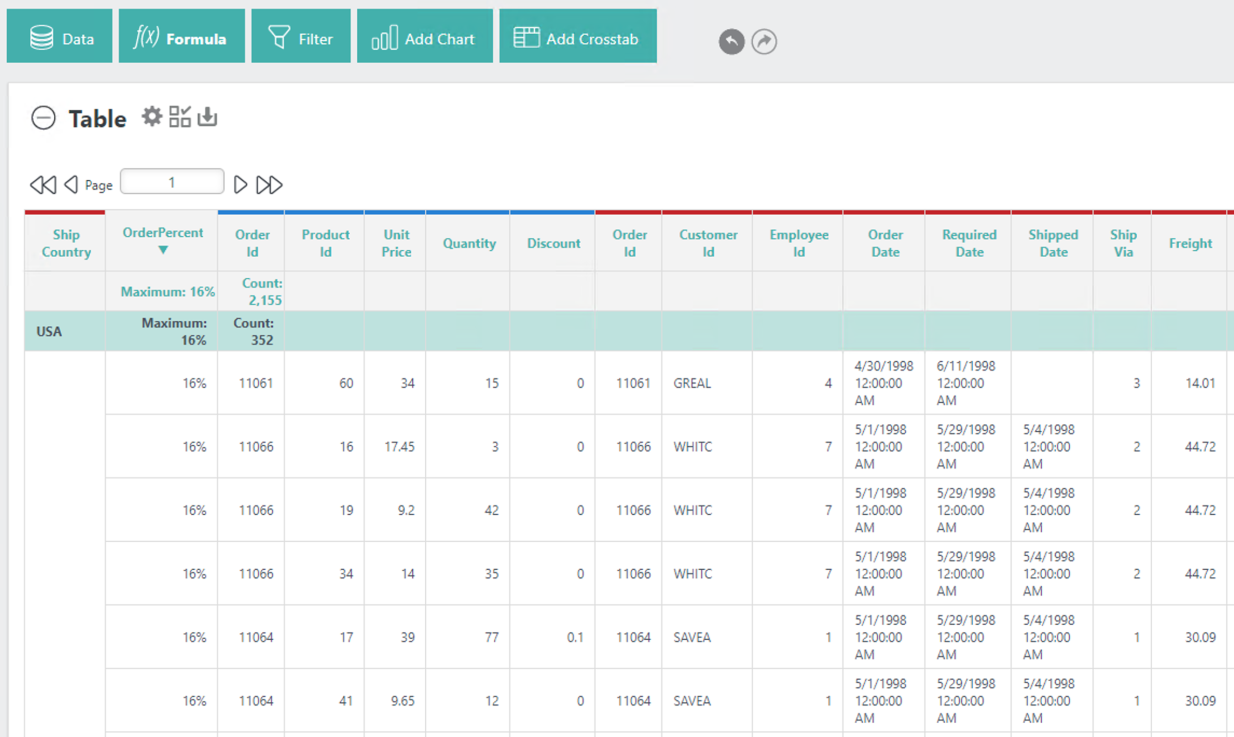
You can also use aggregates and group functions in formulas in your Analysis Grid. In the example below, there are two values that demonstrate the two-level order count for the Order Id. The first row includes the global order count, while the second row specifies the order count for that country. These values are shown as both a number and a percentage. By adding an aggregate function to the formula, you can automatically calculate the second value and have it display in your table.
Below is an example of the new formulas, over(partition BY [xxxxxx]), used to display the two order counts:
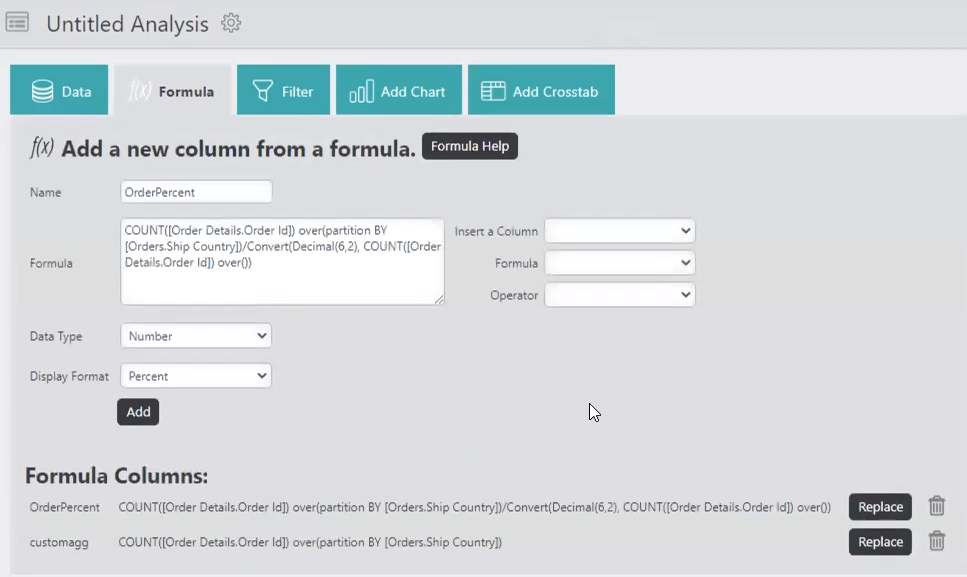
This feature can also be useful if you want to hide a column, but still want the count to be visible in your table. For example, since we created an Aggregate Formula for "customagg" that displays the Order ID and Ship Country Count, we can hide those columns in the table and still see the value.
Select the Order ID column > Hide Column:
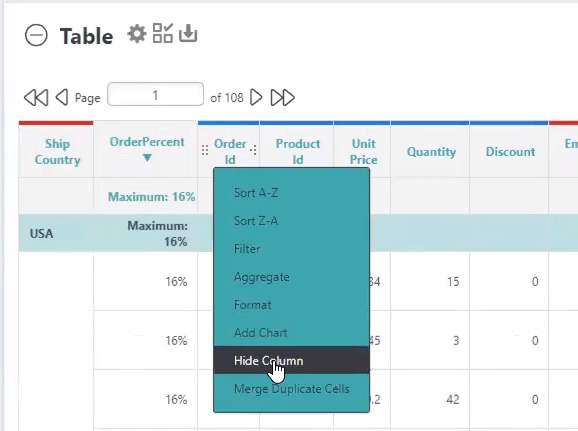
The column Order ID column is no longer visible in the table, but the value for the order ID count is still available as a column (you may need to scroll to the end of the table):
