Analysis Grid - Filtering Rows
Click the Filter tab to use the feature that lets you remove table rows that don't meet your criteria:
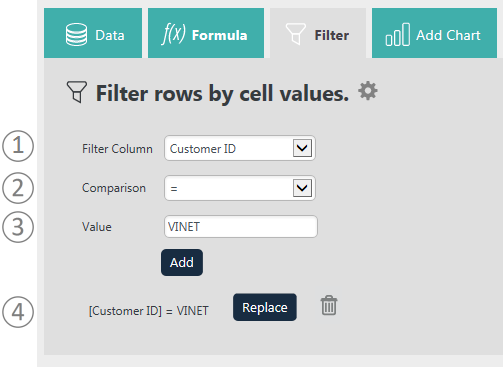
Here's how to use this feature:
- Select the Filter Column containing the values to be compared.
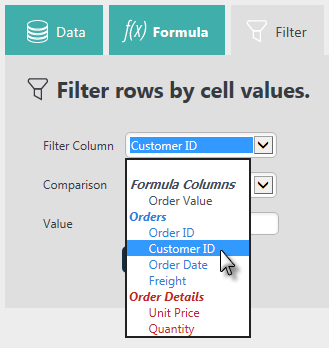
As shown above, you'll see that the options are grouped and color-coded to make it easier for you to identify them. If you created any Formula columns, they'll be in there, too. - Set the filtering criteria by selecting a Comparison operator from the list.
Comparison operators include = , <, >, < =, > =, Not =, Starts With, Not Start With, Contains, Not Contains, Like, Not Like. If the Filter Column is a date, then Date Range is available and some other options are not. The Starts With and Contains operators are useful for finding values at the beginning or within text data. The Not Contains and Does Not Start With operators work in the opposite manner.
Comparison operators In List and Not In List allow comparison against a comma-separated list of values you enter in the Value text box.
When using In List or Not In List comparisons in filters, multiple values can be entered, separated by commas. However, the values themselves may include commas, causing incorrect comparisons.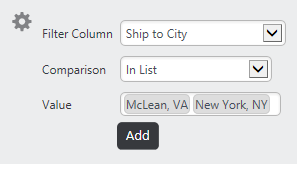
To address this, values for these types of filters are now represented in the controls by visual "pills" that enclose the complete value, as shown above. The filter uses the complete string within the pill during its comparison operation.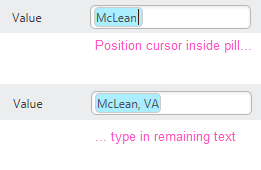
Pills with included commas are created by entering the first part of the value and pressing comma. This creates a blue pill as shown above. Then place your cursor inside the pill and type the rest of the value. Press tab to exit the pill and repeat the process for the next value, if desired.
The Filter feature is usually used to compare column data and a value you enter, but you can also directly compare the values in two data columns: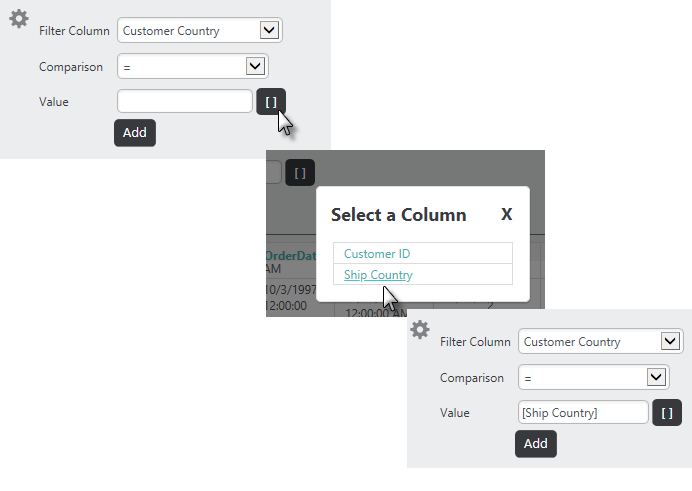
To do this, first select a Filter Column, as shown above, and a supported Comparison operator (= < > <= >= Not=). Then select the second column from the list displayed when you click the [] button, or enter the column name within square brackets.
Depending on the comparison chosen, additional input controls may be displayed, for example, for date ranges. Or you may see a browse button that lets you select values for comparison from a pop-up list of choices.
- Enter a comparison Value. Wildcard characters (*, %) are not allowed in these values. Click Add. Rows that don't meet these criteria will be removed from the table.
- As filters are created, they're added to the filter list. Use the adjacent Replace button and Remove (trash can ) icon to manage the list.
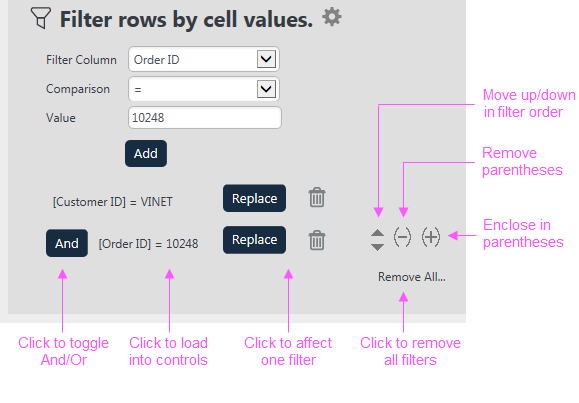
If you add multiple filters, only rows that meet all the conditions will be retained (an "And" situation). Clicking the And link in the Filters list, shown above, changes it to an Or link, so rows that meet any of the conditions will be retained. A set of four arrow icons will also appear by the trash can icon. These can be used to re-order the precedence of the filters or to group them together in various arrangements using parentheses.
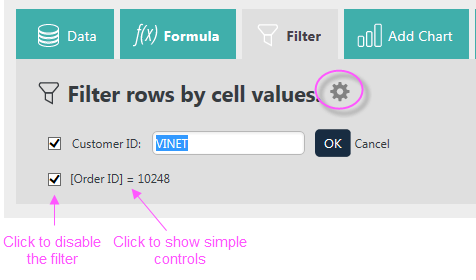
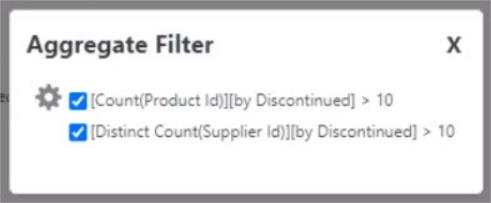
Once filters are configured, you can use the gear icon to collapse the Filter configuration area, as shown above. Check boxes and filter descriptions will remain visible in the area. Uncheck a check box to disable a filter. If you click the description text, simple controls will appear, allowing you to change the filter value.
Filtering by Dates
If the Filter Column selected is a datetype column, the interface presents different value controls:
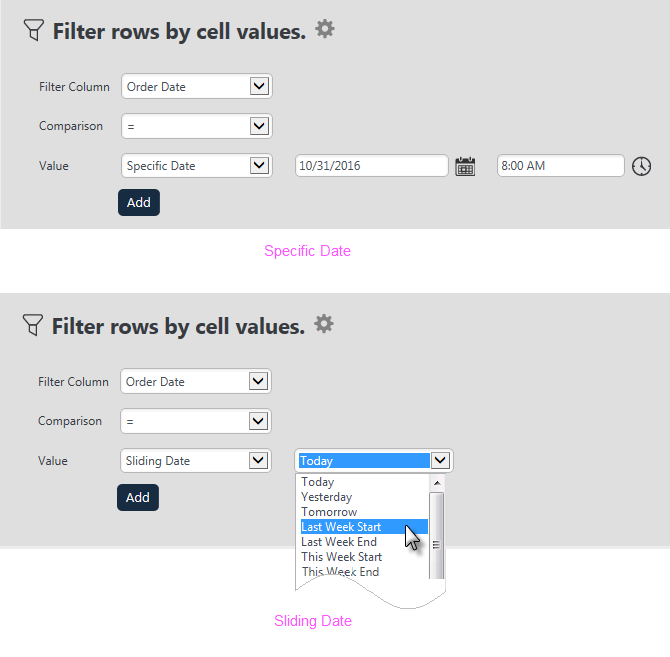
You may choose to filter on a Specific Date and either type it in or select it from a pop-up calendar. Or, you can filter using a Sliding Date value and select from a long list of relative dates (Last Week End, Last Month Start, 90 Days Ago, Current Hour, Last Hour, etc.)
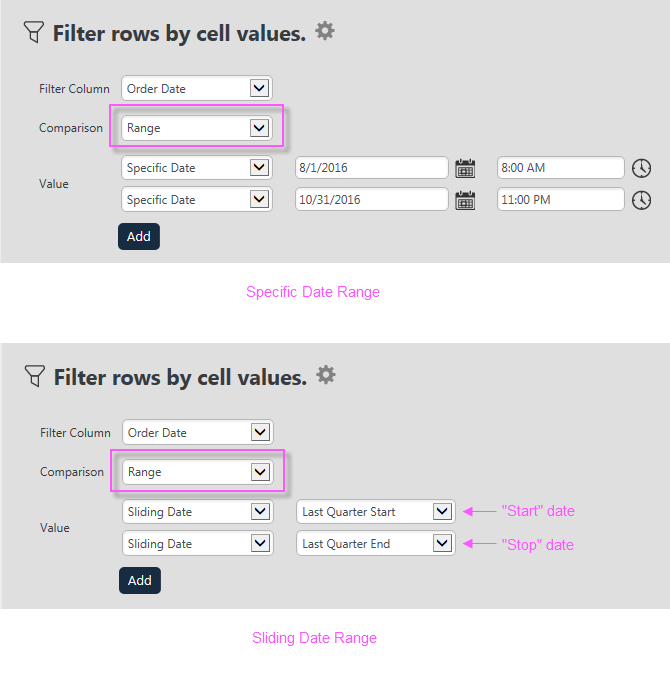
If the Comparison option Range is chosen, as shown above, different value controls for Starting and Ending dates are displayed. These can be used in a variety of combinations.
 New for 14.2 Selecting the Customize... button, or choosing Customize... from the drop-down menu allows you to customize the time frame for your analysis. This option is only available for use with date/time-type data when Sliding Date is selected.
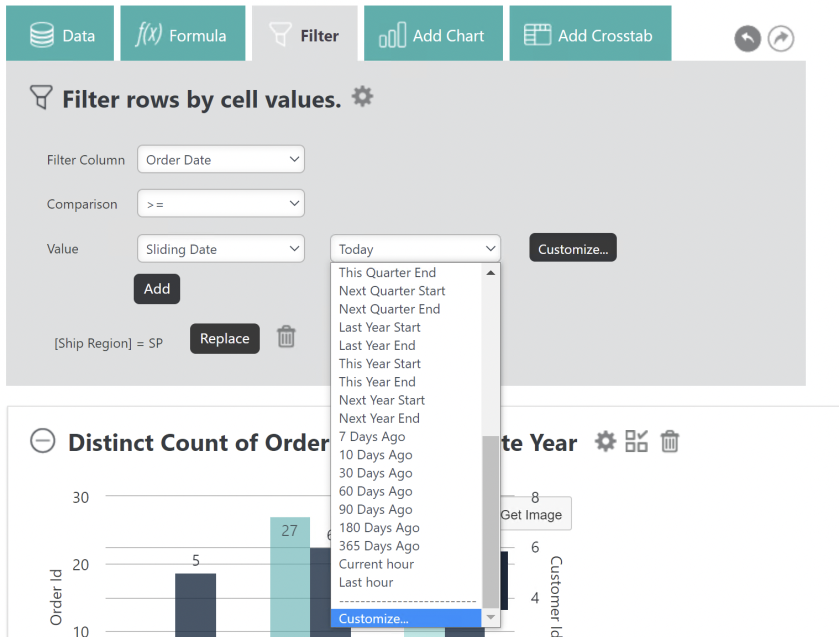
Upon selecting Customize... additional fields generate, with default values, where you can manipulate the data:

![]() Usually Start and End is a range. You may need to change your Comparison value.
Usually Start and End is a range. You may need to change your Comparison value.
If you choose any value other than Hour in the drop-down list, the value On will be added to the Start/End drop-down list. The time picker only displays when Start, End, or On is chosen.

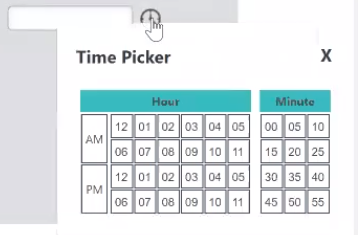
Specify a time by selecting the time picker:

To apply the filter, select Replace and OK:

The filtered results reflect the sliding date and specified time.
Click the Filter tab or button to hide the panel.
Filter by Aggregate
You can now apply filters on aggregates in your Analysis Grid. This feature is only supported on the following database versions:
- MySQL > = 8
- SQLServer > = 2005
- Oracle > = 9
- PostegreSQL > = 8
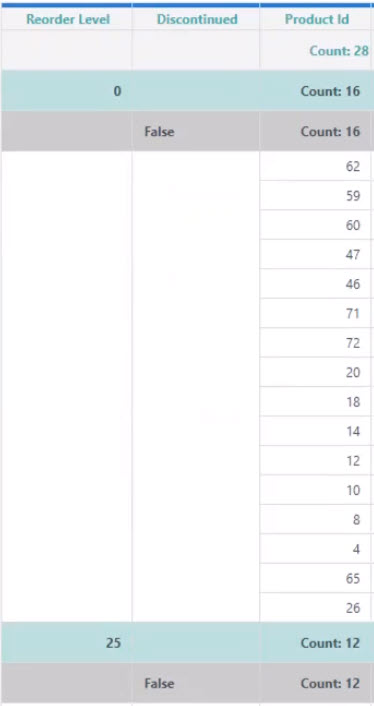
In the example below we grouped the columns Reorder Level and Discontinued. Then, we applied an aggregate of Count on the Product Id column, Discount on the Supplier Id column, and Average on the Unit Price column:
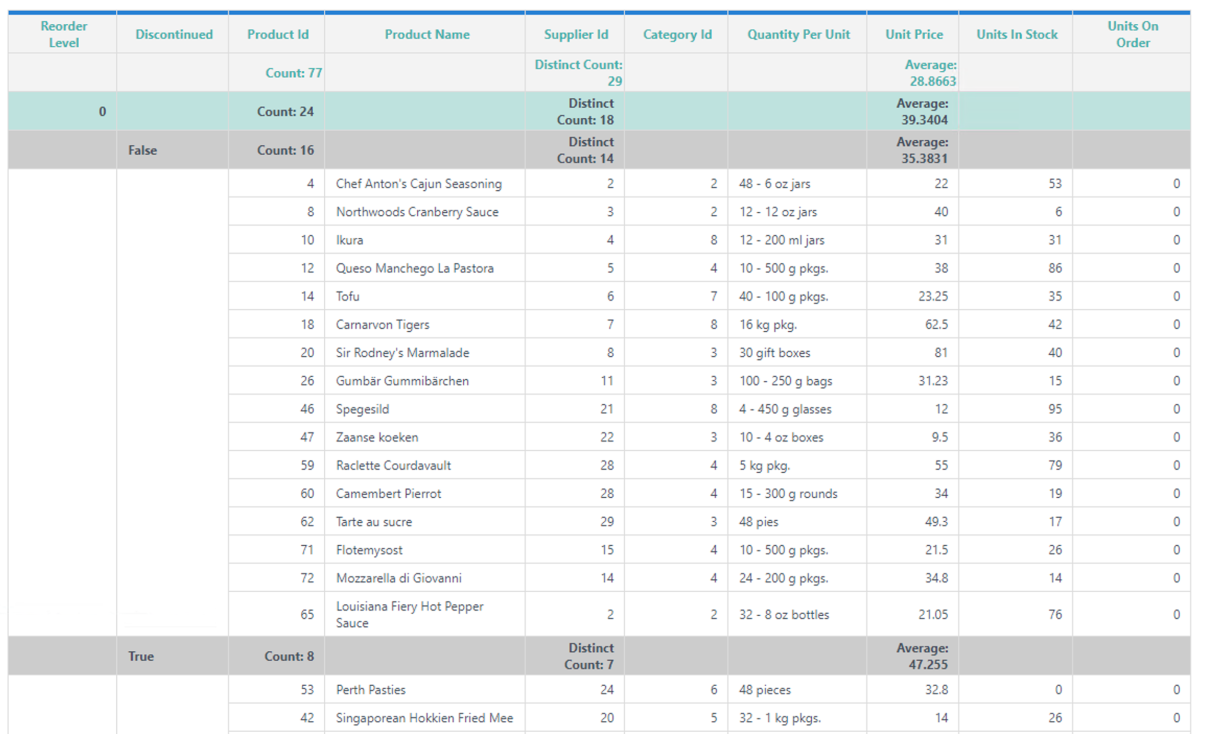
Narrow down the results of an aggregated column by applying a filter on the aggregate. In this example, we want to apply an aggregate filter that distinguishes any Count over 10.
-
To access the new feature, select the Aggregate tab and then select the filter icon:
![]()
The Aggregate Filter dialog box appears.
-
Select the Filter Column drop-down:
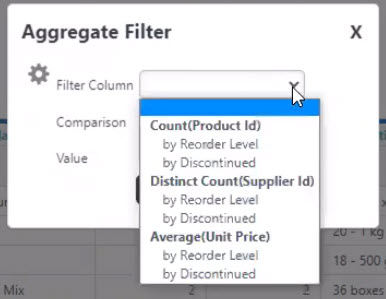
-
After you select the desired Filter Column, add a Comparison and enter a Value.
-
Then, select Add.
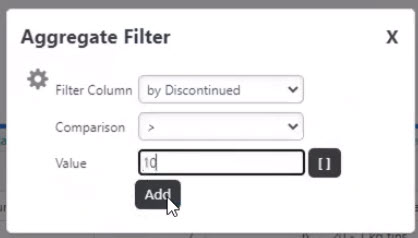
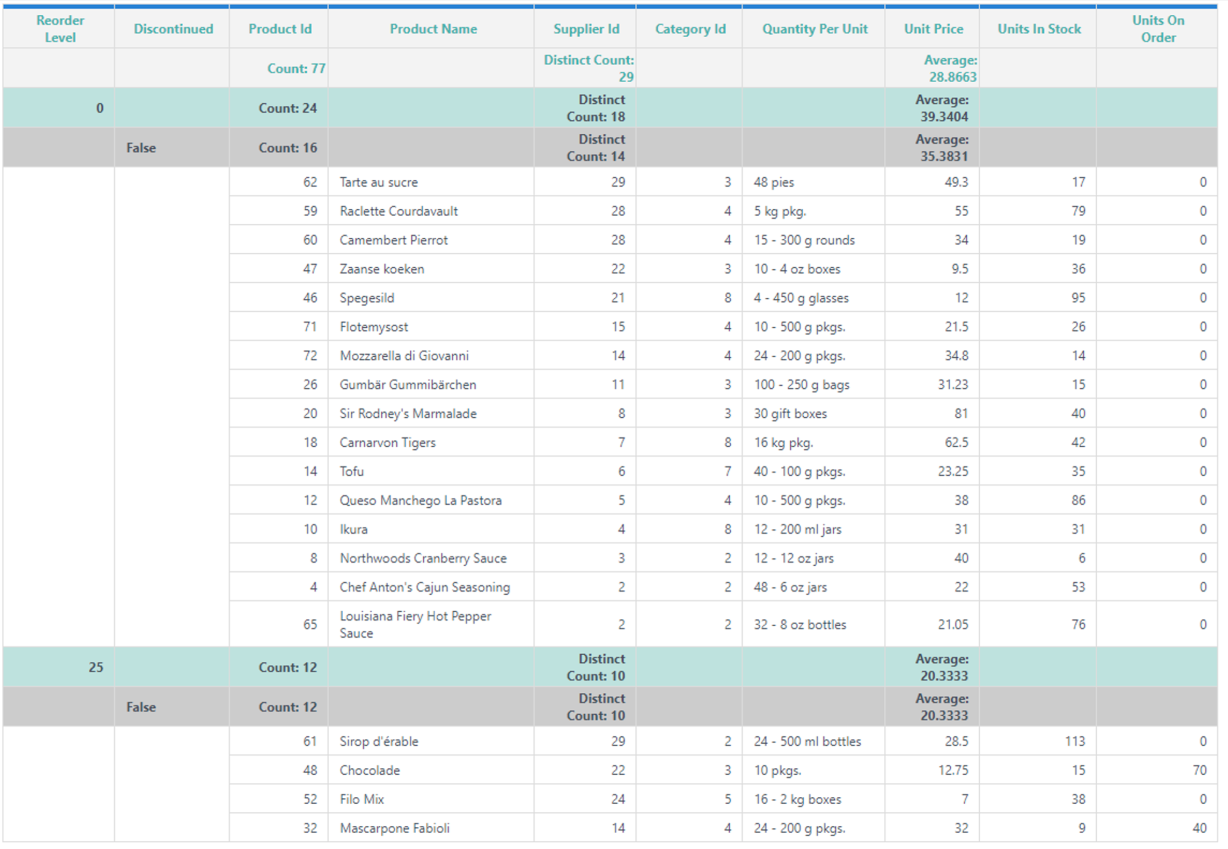
Now, our Analysis Grid displays Count values over 10 for the Product Id column:
![]() Repeat these steps to add aggregate filters to additional columns.
Repeat these steps to add aggregate filters to additional columns.
Currently, the relationship between the two filters is And. Select And to change the relationship to Or.
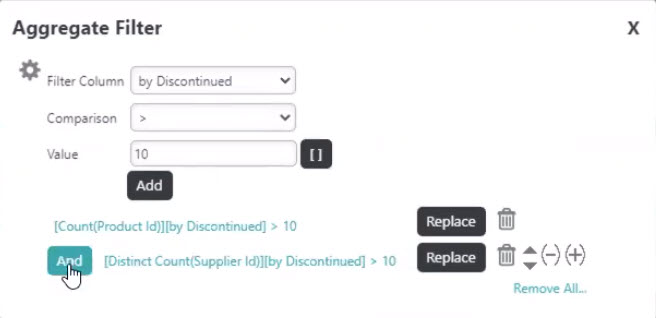
You can temporarily disable one (or both) of these filters by selecting the gear icon next to the Filer Column and selecting the corresponding check box:
![]() You can also apply filters on the aggregates created through formula and it will populate as an option in the Filter Column drop-down menu. Below is an example of the CountCustomer formula we created using an aggregate:
You can also apply filters on the aggregates created through formula and it will populate as an option in the Filter Column drop-down menu. Below is an example of the CountCustomer formula we created using an aggregate:
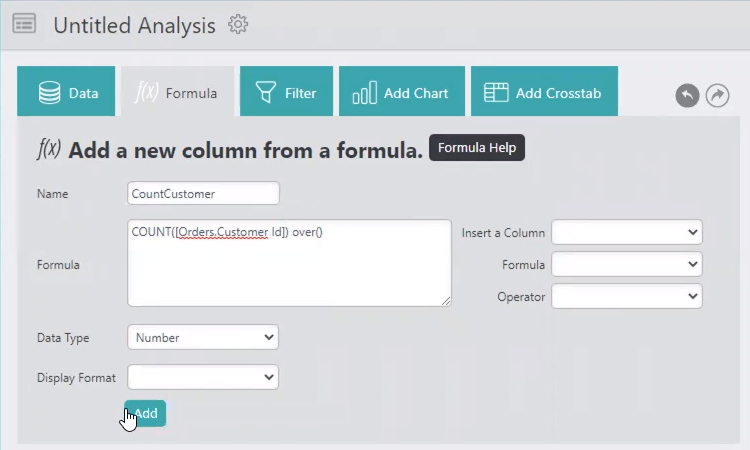
Once you select Add, the new formula will populate the Filter Column drop-down menu:
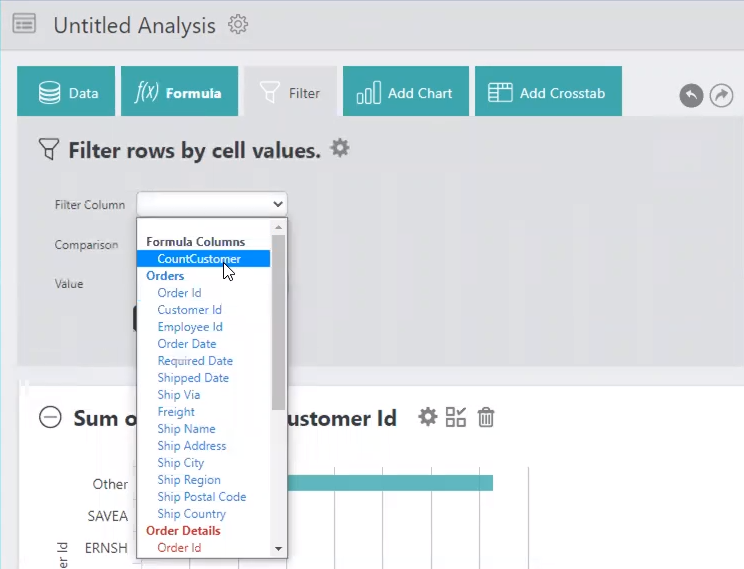
For more information about adding aggregate formulas, see Analysis Grid - Adding Formula Columns.
Recalculate Based on Filter
The Recalculate based on Filter check box is useful if you want to reset the column's overall aggregate value.
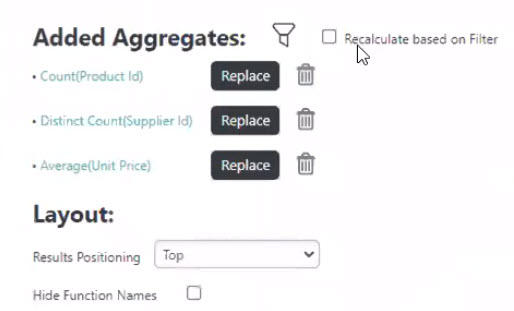
In this example, the Product Id column has an aggregate of Count that still reflects the overall Count (77) prior to adding the aggregate filter:
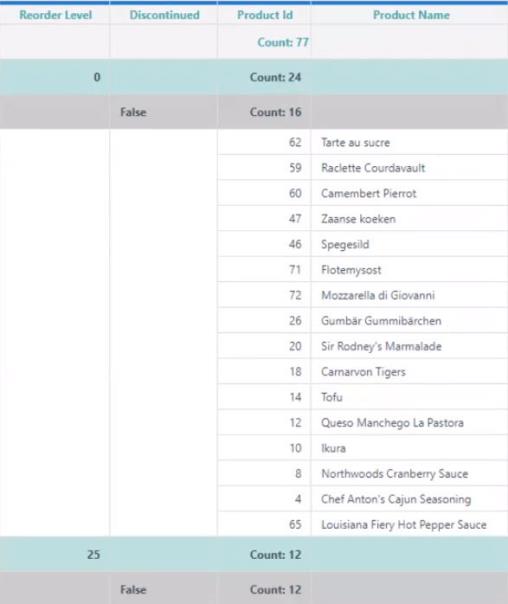
After selecting the Recalculate based on filter check box, the new Count is 28:
