Testing and Debugging Applications
While developing a Logi application, you'll want to periodically check your work by viewing it, and Logi Studio provides several ways to do this.
Using the Preview Tab
The Preview tab, at the bottom of the Workspace panel, provides the
developer with a fast way to view the report definition currently being edited.
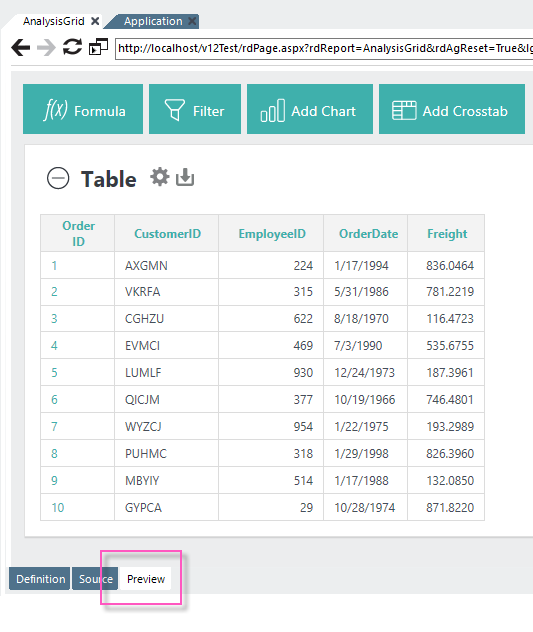
To preview a report definition that's open in the Workspace panel:
- Ensure that the desired report definition is the selected definition in the workspace.
- Click the Preview tab at the bottom of the Workspace panel, as shown above.
- Browse and interact with the report definition using the toolbar at the top of the Preview panel.
![]() Clicking Preview will save all open definitions before displaying the report.
Clicking Preview will save all open definitions before displaying the report.
When using Preview, any JavaScript errors thrown will cause a count of the errors to appear next to the preview URL:
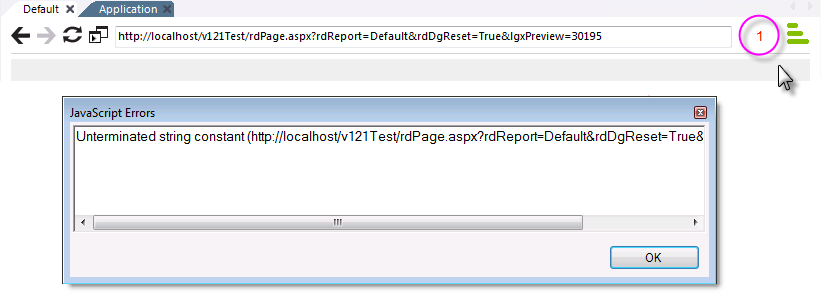
Click the number, as shown above, to display a dialog box containing the JavaScript error message. In earlier versions of Studio, the dialog box will simply be displayed automatically, interrupting execution.
Using the "Live Preview" Feature
The Live Preview feature allows you preview your work in a separate, "live" desktop window.

The Main Menu's Live Preview item is shown above. The live preview will be displayed in a separate window and any changes made to the definition will immediately be reflected in that window. You can resize and relocate the new preview window as desired; you can even drag it onto a separate display, if you have one.
You can also switch to Live Preview from regular Preview mode:
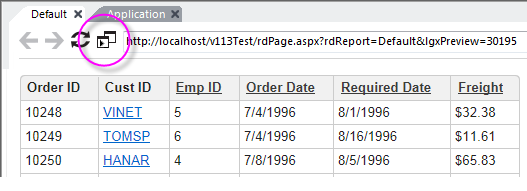
To start Live Preview, first preview the report definition, using the Preview tab, and then click the Live Preview icon, circled above.
The preview will be displayed in a separate window, and Studio will switch back to its Definition tab. You can resize and relocate the new preview window as desired; you can even drag it onto a separate display, if you have one.
Any subsequent changes you make to the definition code will immediately be reflected in the Live Preview window.

If you don't want definition changes to be updated immediately in the Live Preview window, you can pause and restart them, using the Pause and Play icons in the Live Preview window, circled above.
To exit Live Preview, just click the Live Preview window's X icon.
Browsing the Default Report Definition
In a Logi application, one of the report definitions is designated (in the _Setting definition) as the "default" report - the page that will be shown if no definition is specified in the URL. If you don't change it, this is usually the Default report definition.

You can browse the default report by clicking the Run Application menu item, shown above, in Studio's Main Menu, or by pressing the F5 key. Your computer's default browser (the one associated with .htm/.html file extensions) will be used for this.
You can change the "default" report designation using two methods:
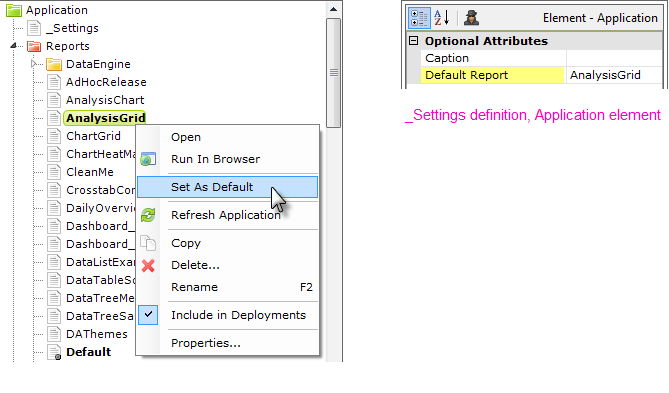
As shown above, left, in the Application panel, select the desired report definition, right-click it, and select Set As Default from its context menu. This sets the Application element's Default Report attribute, shown above, right, in the _Settings definition. You can also manually edit this attribute value directly in the _Settings definition.
Using the Run Application menu item will save all open, unsaved definitions before displaying the report.
Browsing Any Report Definition
You can also browse any report definition without opening it in the Workspace panel, or setting it as the default report:
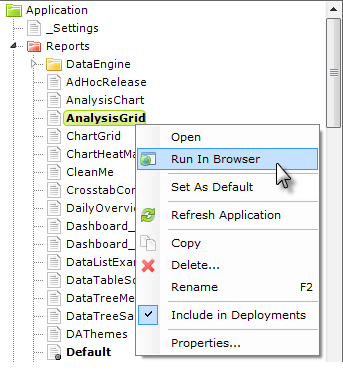
As shown above, select the desired report definition, right-click it, and select Run In Browser from the popup menu. Using this menu item will save all open definitions before displaying the report definition.
Using the Test Parameters Panel
One of Studio's least well-known panels is the Test Parameters panel. Studio makes this panel visible when the current definition expects to receive and use parameters. It provides a way for developers to supply request variable values for their definitions when previewing them in Studio, and it makes experimenting with different values very easy.
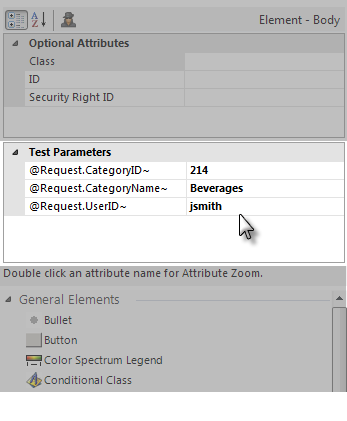
The example above shows this panel in use. Studio will automatically populate the left column with the tokens for any request variables expected by the currently selected definition in the Workspace. You can enter values for those tokens, and they'll be fed to the definition when you Preview it in the Workspace panel, or right-click it in the Application panel and select "Run in Browser".
![]() The token values in Test Parameters are not fed to the application when you click the Run Application menu item or press the F5 key.
The token values in Test Parameters are not fed to the application when you click the Run Application menu item or press the F5 key.
Using the Debugging Features
Logi Studio also provides debugging features for an application, but they have
to be enabled to work. They are not enabled by default.
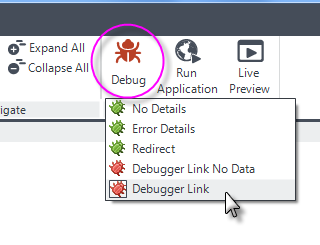
You can turn on comprehensive debugging for all your report pages by clicking the Debug menu item, shown above, and selecting Debugger Link from the selection list.
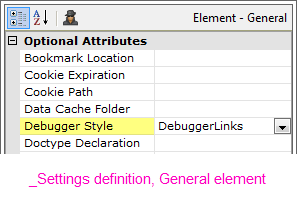
Selecting a debugger option in the menu sets an attribute value in the _Settings definition, as shown above. This value can also be set manually.
When the Debugger Style has been set to DebuggerLinks and the report is run, a Debugger Trace Report is generated. It can be accessed in
three ways: using the debug icon which will now appear in your report pages, from a
link that appears on a runtime error page, or by setting two attributes to pull runtime error and debug information into log files directly. The trace report appears either in
the Preview panel or in your browser, depending on which method you were using
to view your report.
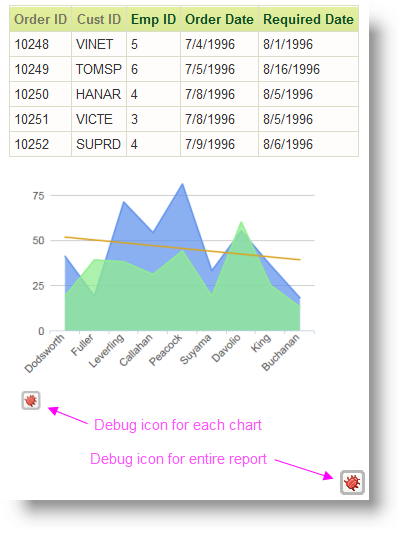
As shown in the example above, the debug icon for the report "floats" in the lower right-hand corner of the browser window, so you don't have to scroll down to use it. Any charts, which are processed separately by the Logi Engine, will have their own debug icon and trace report.
Developers can integrate modern logging framework using Log4Net and Log4J. ![]() You must update to Log4j v2.15 to mitigate this 0 day vulnerability. For more information about this vulnerability, refer to this statement.
You must update to Log4j v2.15 to mitigate this 0 day vulnerability. For more information about this vulnerability, refer to this statement.
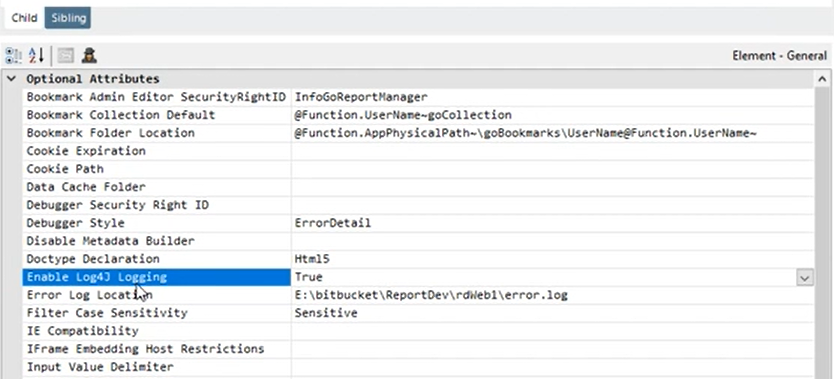
To pull runtime error and debug information into log files directly, set the attribute Enable Log4J Logging to 'True', like below:
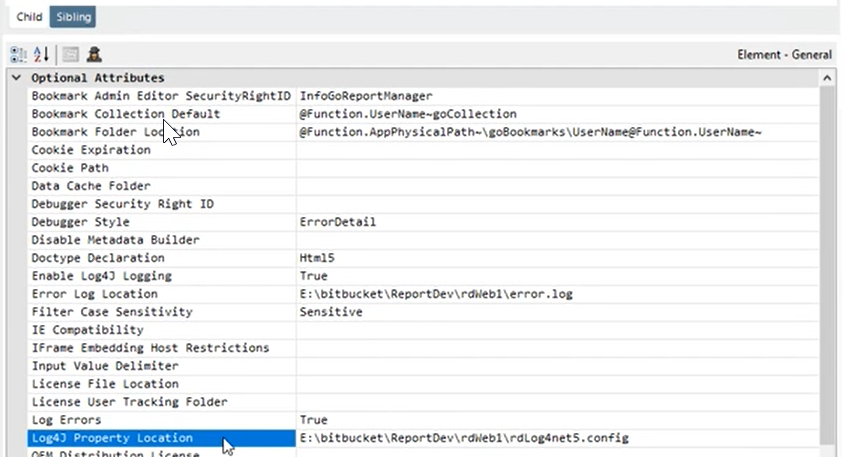
Then, enter a file location in the Log4J Property Location attribute, as shown below:
Below is an example of a Log4J properties file:
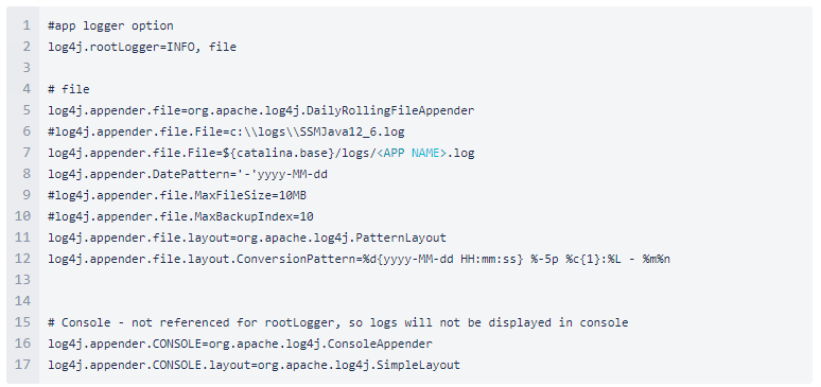
Developers can configure the application to log different logging levels through the property file.
| Log4J | Logi Info |
|---|---|
| DEBUG | Debugger No Data |
| INFO | Event Logging |
| WARN | Warning |
| ERROR | Error Details |
| OFF | Disabled Logging |
For more information about debugging, see Debug Reports.
Using the Element Seeker
Logi Studio includes a feature, the Element Seeker, that lets you quickly locate an element in a definition file by selecting it in your preview or browser window. To use it, you must be working in Logi Studio v12.2 SP5+ and the Logi Server Engine version of your Logi application also has to be v12.2 SP5+. In addition, if you're using the Internet Explorer browser, you must be using IE 9 or
later. Here's how it works:
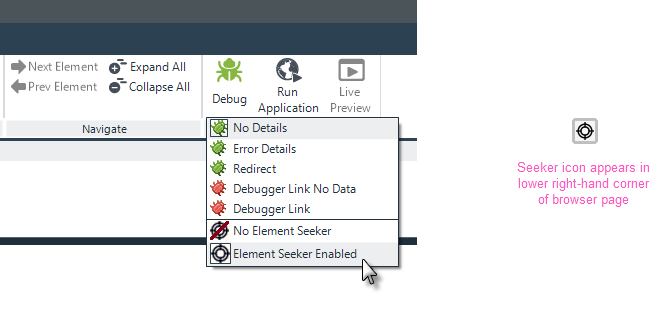
Enable the Element Seeker in Studio's Debug menu, as shown above. When you preview or browse a report page, you'll see the Seeker icon in the lower right-hand corner.
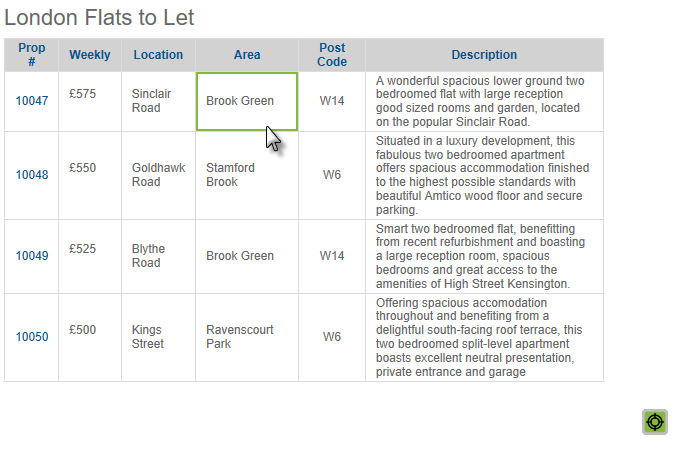
When you click the Seeker icon, it will turn green and enter selection mode. As you move your mouse cursor around the page, different regions will be framed in green, as shown above. Click a framed region...
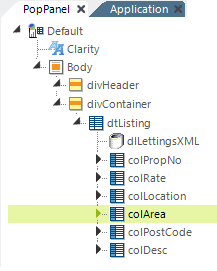
... and Logi Studio will open the correct report definition and select the element responsible for the chosen region, as shown above.
To turn off the Seeker's selection mode, you'll need to refresh your preview or browser page.