Analysis Grid - Formatting Data
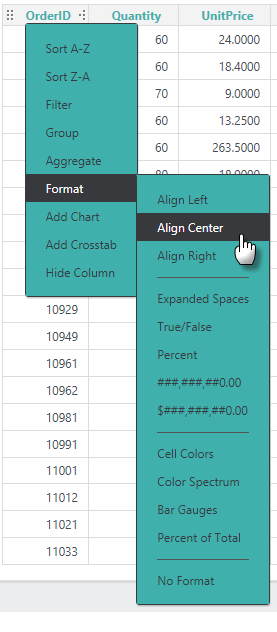
You can format the appearance of the data in the Table by clicking a table column header and selecting Format and then the desired option:

These options allow you to apply, or remove, a variety of standard formats. For more information about these formats see Format Data.
![]() Selecting No Format will clear previously-selected numeric or color formatting but not alignment.
Selecting No Format will clear previously-selected numeric or color formatting but not alignment.
The Percent of Total format applies a calculation that determines each data value's percentage of the summed values and displays it as a percent.
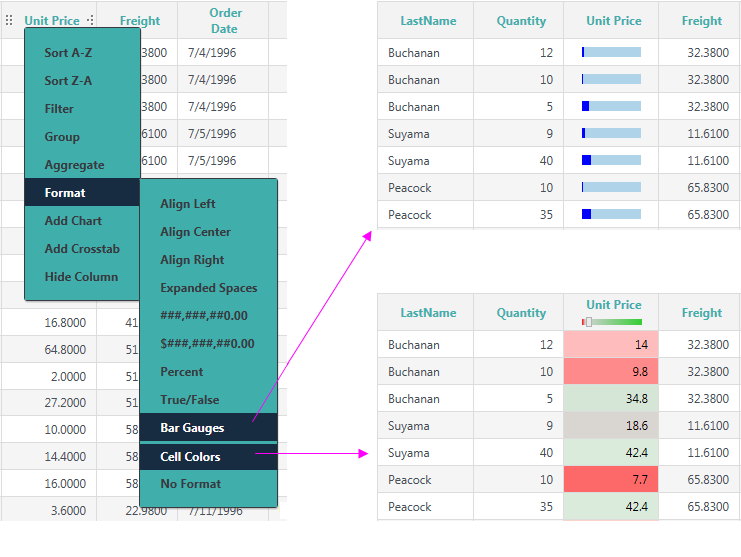
Two special format options insert visualizations right into the column:

Selecting the Bar Gauges option will produce a horizontal bar gauge within the column, as shown above. The actual data value will appear in a tooltip if you hover your mouse over the gauge. Selecting the Cell Colors option will display the column value using an imbedded Cell Color Slider, as shown above. You can drag the slider in the column header to customize the color ranges.
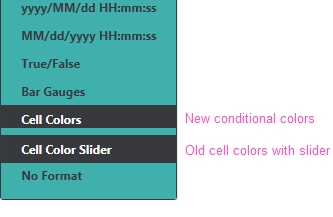
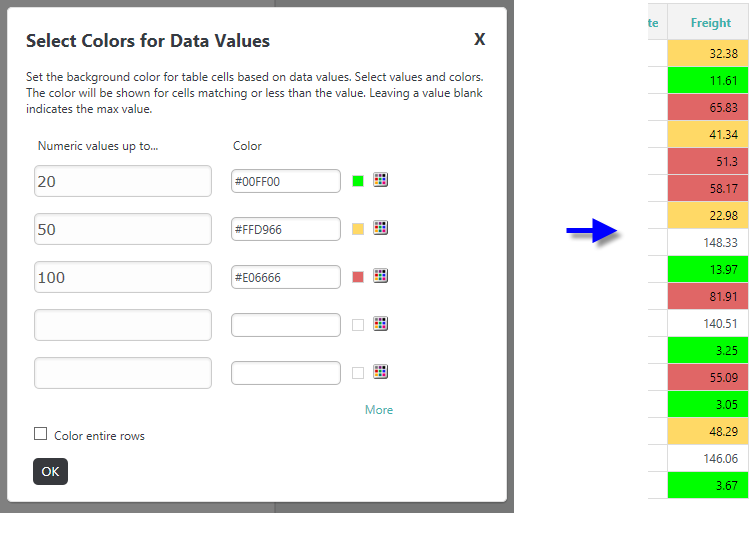
The Cell Colors feature has been changed to allow you to apply conditional colors:

Its previous functionality is now represented by a new Format menu item, Cell Color Slider, as shown above.

The menu's Cell Colors item now displays the pop-up dialog box shown above, where you can select data value ranges and cell background colors.