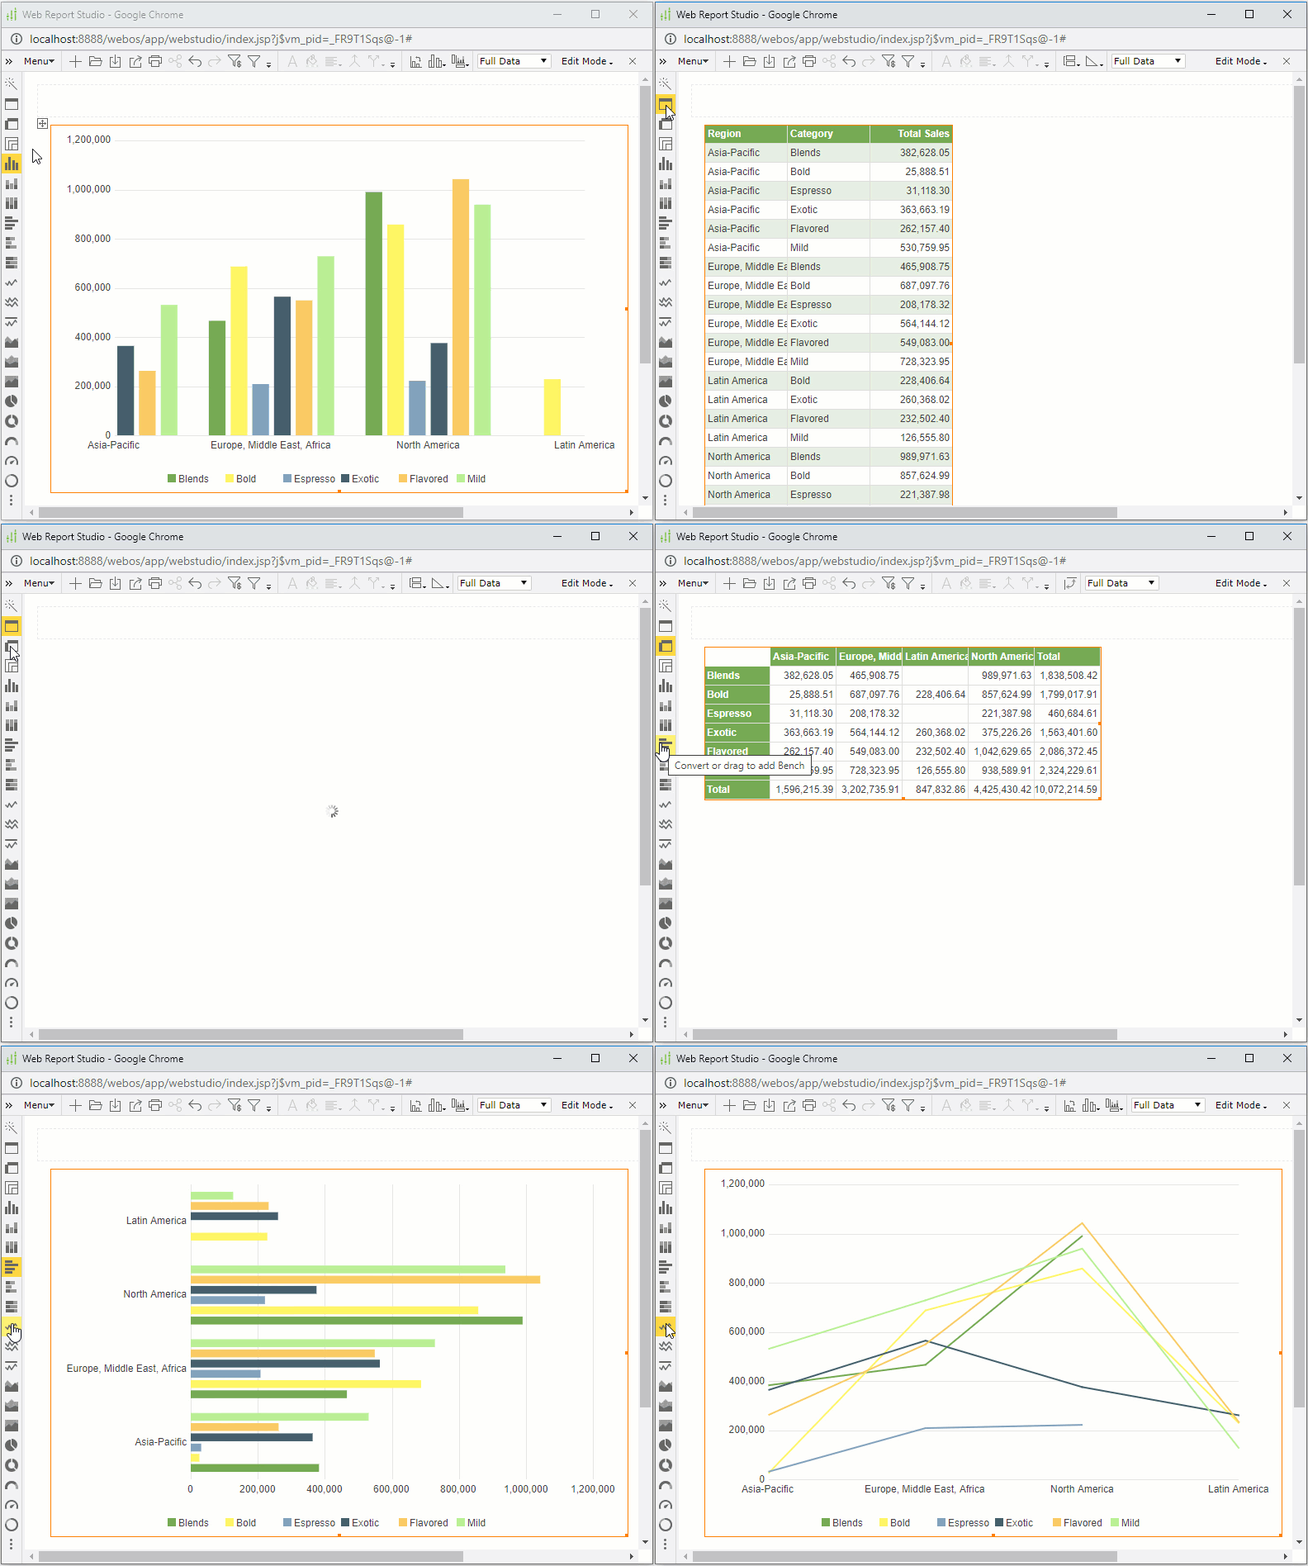
One-Select to Convert Table/Crosstab/Chart
In Web Report Studio, you can use the visualization toolbar to convert a table/crosstab/chart to any of these types by one-selecting. You can also change one chart type to another chart type by one-selecting. The visualization toolbar provides all the available component types that the current data component can be converted to. When the current data component contains enough data fields for the target component type, Web Report Studio accomplishes the conversion directly; otherwise, a conversion dialog pops up which allows you to reload all the data fields from a business view and then to define the target component.


