Lesson 1: Creating a Web Report the Quick Start Way
In this lesson, we will create a web report the quick start way and learn about the visualization toolbar which is also available in the standard way.
This lesson contains the following tasks:
- Task 1: Create a Web Report
- Task 2: Convert the Table to a Crosstab
- Task 3: Convert the Crosstab to a Chart
Task 1: Create a Web Report
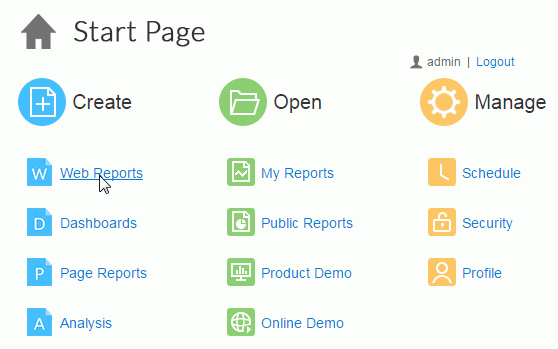
- On the Logi JReport Server Start Page, select Web Reports in the Create category.
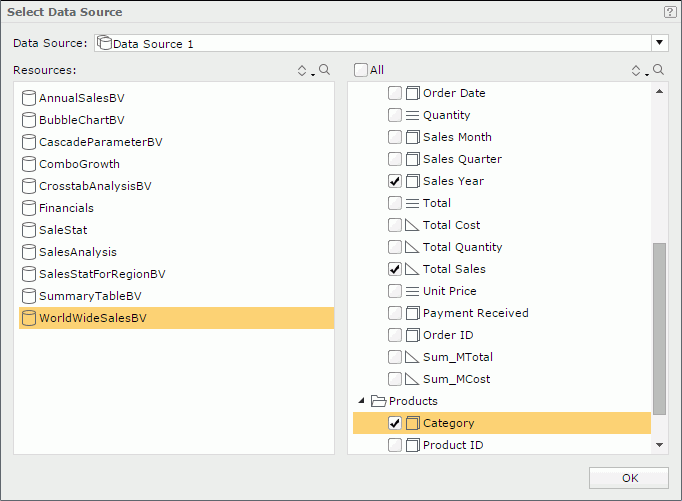
- In the Select Data Source dialog, select WorldWideSalesBV from the Resources panel and the data fields Region, Sales Year, Total Sales, and Category from the business view to display in the table report. Select OK.
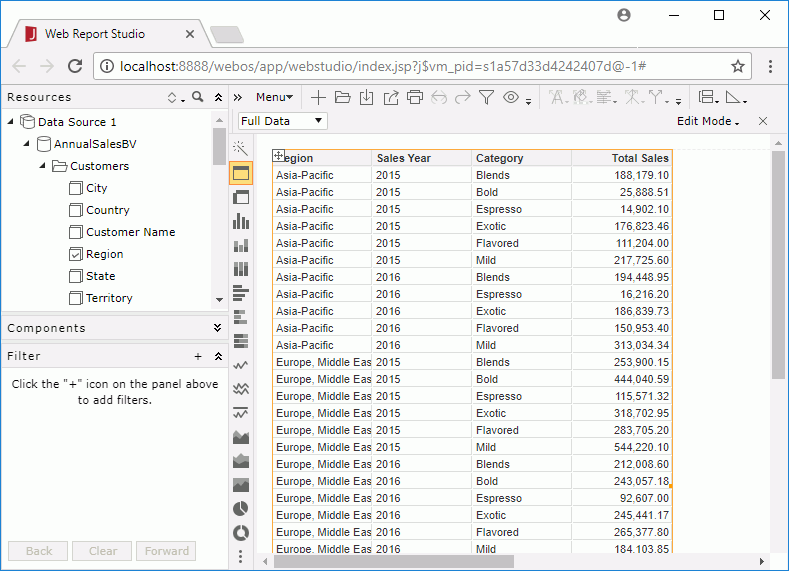
- A table is generated.
Task 2: Convert the Table to a Crosstab
- Select
 on the visualization toolbar on the left to convert the table to a crosstab:

- We will adjust the fields using the wizard to build a better looking report. Select
 on the visualization toolbar and the Crosstab Wizard is displayed.
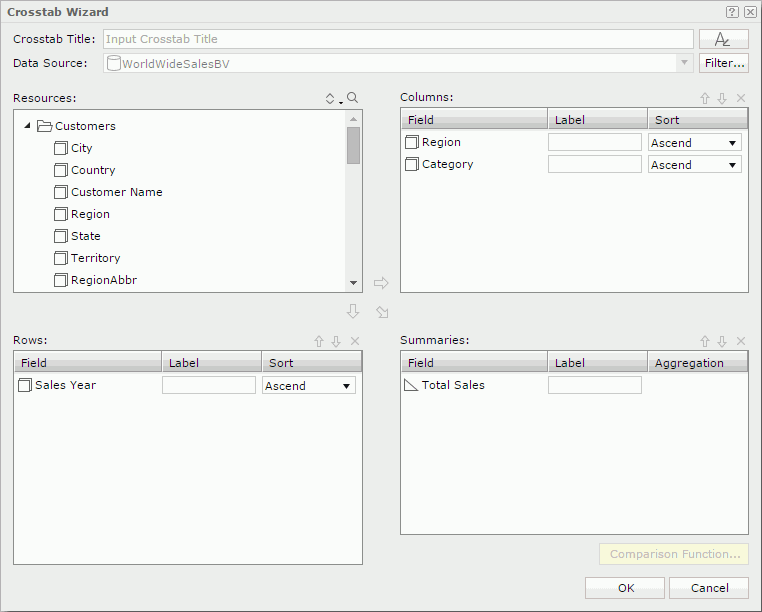
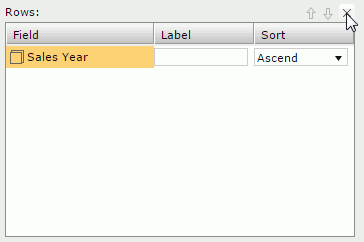
- In the Rows box, select Sales Year and then select the x button at the top right of the box to remove it.
- Also remove Category from the Columns box.
- In the Resources box, browse to the Products category at the bottom and select Category. Then select
 to add it to the Rows box.
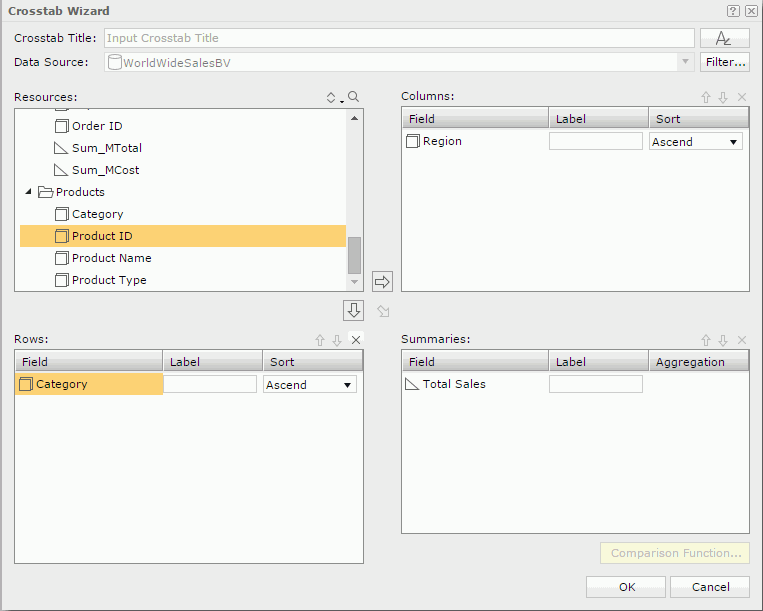
- Select OK to confirm the changes. A message dialog is displayed asking for your confirmation of the change. Select OK in the dialog. Here we get a new crosstab.

Task 3: Convert the Crosstab to a Chart
- There are many chart types available to the crosstab on the visualization toolbar. Select
 to convert the crosstab to a bar chart:
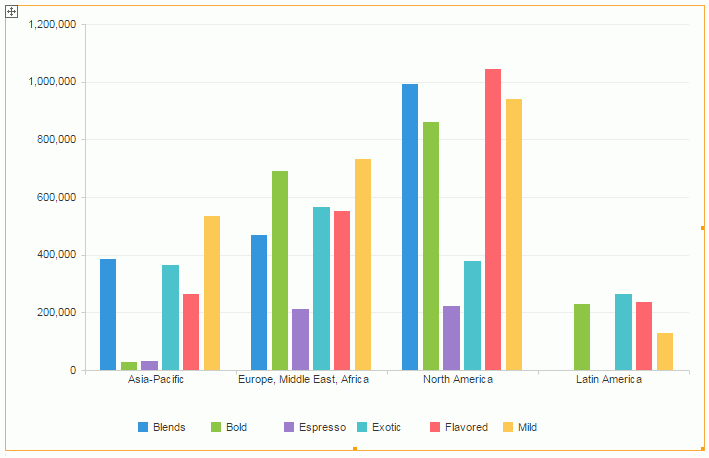
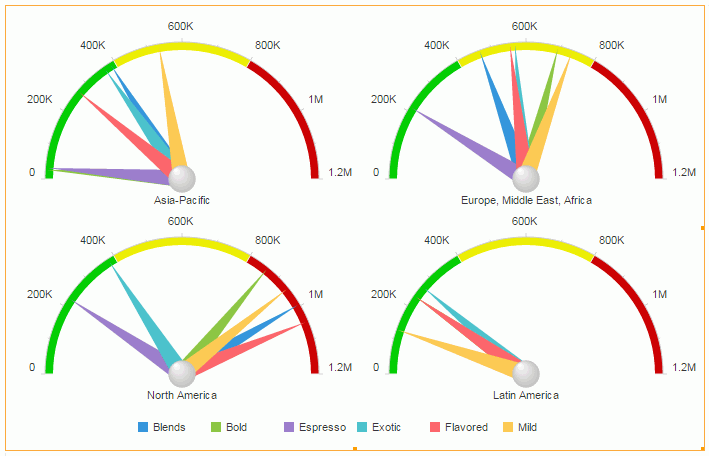
- If you'd like to view the data in a different chart type, select another chart type button on the visualization toolbar. Here, we select
 to change it to a gauge chart.
 Previous Page