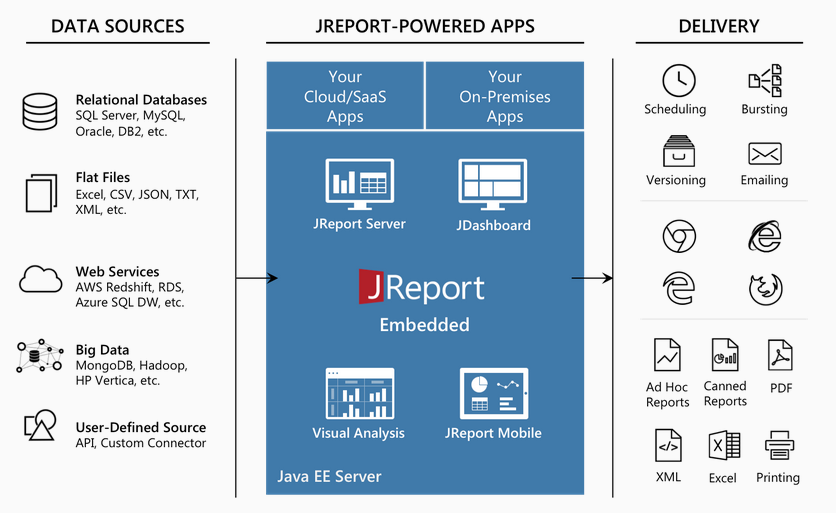
Logi JReport Product Overview
Logi JReport delivers operational business intelligence to enterprise applications through powerful embedded reporting.
Logi JReport is a complete Java reporting solution that provides sophisticated enterprise reporting, ad hoc reporting, and data analysis. A 100% Java EE architecture and a rich set of APIs allow Logi JReport to be seamlessly embedded into any application, providing end users with a transparent interface to easily generate reports, share information, and analyze data. With Logi JReport, any report can be made interactive, extending the "life" of a report by allowing users to easily sort, group, navigate, and filter via the Web. This wide range of functionality, including the ability to drill down on data, enables users to quickly derive value from their business intelligence.
Logi JReport's architecture takes advantage of the portability, scalability, and ease of integration associated with Java EE technology to provide a powerful, flexible reporting solution that fits perfectly within any application architecture.

Logi JReport Designer is a Swing-based Integrated Development Environment (IDE) that enables sophisticated report design and presentation of critical business data. It provides an intuitive interface, reusable report components, flexible layout, and a toolset for designing and testing reports. With Logi JReport Designer, you can build reports using simple drag and drop techniques or by using the Report Wizard. Data can be accessed from any data source to design and preview reports in order to deliver information to end users in the most relevant and intuitive manner. Rapid creation and modification of reports is accomplished by toggling between design mode and view mode where the report will be displayed with the actual dataset. Once report design is complete, the report is published to Logi JReport Server for generation, delivery, and management.
Logi JReport Server is a 100% Java report generation and management tool. It enables efficient management, sharing, scheduling, versioning, and delivery of reports and enables reporting to be integrated into the workflow of any Java application. The high-performance engine can scale to any workload. Report results can be saved to a versioning system, sent to enterprise/workgroup printers, or e-mailed. With Logi JReport, reports can be viewed in any modern enterprise format including Page Report and Web Report using any standard browser, HTML, TEXT and standard business documents, such as PDF, Excel, and RTF. Logi JReport Server also supports on-demand, live report creation and modification, providing Logi JReport’s powerful ad hoc solution.
JDashboard delivers interactive data visualization and analysis to users. Users can freely choose the objects they want to display in the dashboard, without having to know how these objects were created, what data sources to use, what styles to set, and so on. A dashboard can hold multiple data components so that when browsing the dashboard users are able to see multiple data aspects. Within a dashboard, data components are able to communicate with each other via the message mechanism. This allows actions such as common filters to be applied to all the components of a dashboard even when coming from different data sources.
Page Report Studio and Web Report Studio enable reports to be accessed through a web browser via Dynamic HTML, or AJAX. With Page Report Studio and Web Report Studio, end users can create their own richly visual and interactive reports for powerful and secure data exploration in a completely self-service manner. Using Page Report Studio and Web Report Studio's advanced capabilities, users can modify reports using dynamic filter and sort, drag and drop columns to and from an existing report, dynamically change chart types, pivot crosstabs, drill report data to specific groups, and convert report components or create an entirely new report.
Visual Analysis is a WYSIWYG product to visualize the result of every work step. Simply by dragging and dropping data fields onto a layout module, users are able to visually create crosstabs and charts step by step. The use of colors, sizes, shapes, and pie slices demonstrates the data in rich aspects.
 Previous Topic