Analysis Grid Developers - Configuring Add-to-Dashboard
The Analysis Grid allows users to generate a Data Table or chart, then add it as a new panel in an existing Dashboard in another report. This is the "Add-to-Dashboard" feature.

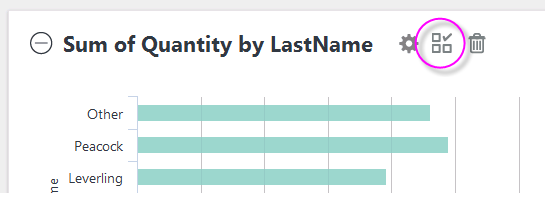
When properly configured, Analysis Grid charts will display an Add to Dashboard icon, shown circled above.

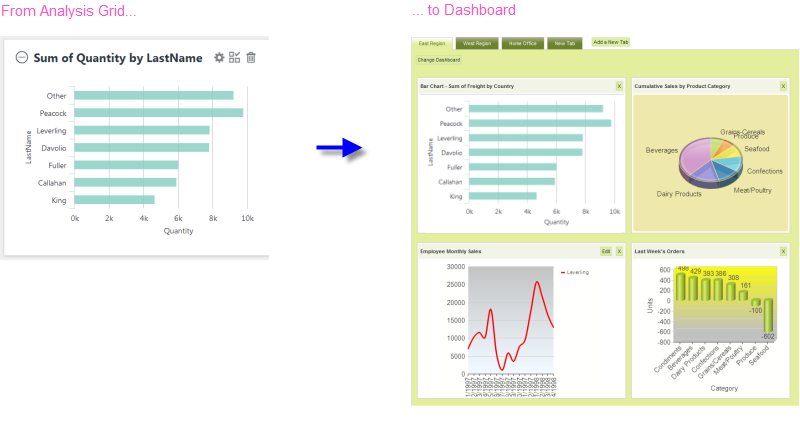
When the icon is clicked, the chart, with its resizing control, is added as a new panel in the Dashboard, as shown above. When the resizing control is used to resize the chart, the widths of the Dashboard columns and other panels will adjust dynamically.
Behind the scenes, when the icon is clicked, the Analysis Grid writes the underlying XML for its chart into the Dashboard's configuration file (its "Save File"). In the Dashboard, the chart is inserted at the top of Column 1; if Dashboard tabs are being used, the insertion occurs in the currently active tab.
Just before panel insertion, the user will be prompted for the Panel Title (with the chart title from the Analysis Grid provided as a suggestion) and a description for display on the Configuration Page:

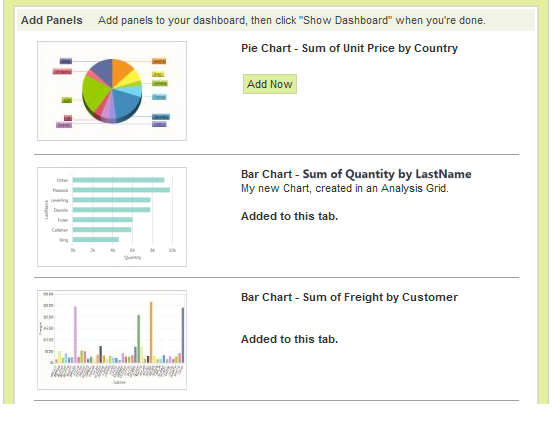
The new chart panel thereafter appears in the Dashboard Configuration Page, as shown above, just like any other panel, complete with a thumbnail image. The new panel can be removed from the visible Dashboard panels and from the configuration page entirely, using the usual controls.
The user can insert multiple charts into a Dashboard using this technique.

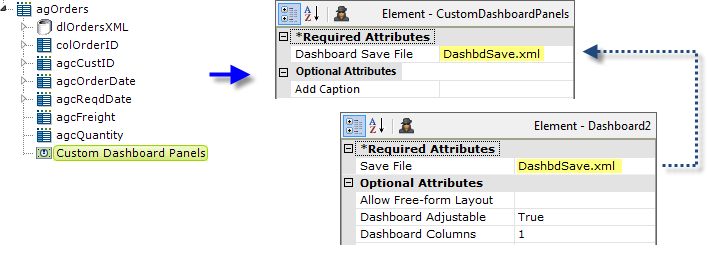
In the report definition, the developer makes this functionality available by adding a Custom Dashboard Panels element, shown above, beneath an Analysis Grid element. Its Dashboard Save File attribute value should be set to match the target Dashboard's Save File attribute value.
![]() The Save File attribute values shown above have been shortened for visual clarity. However, a fully-qualified path and file name, with .xml extension, is required, so a realistic attribute value would be something like:
The Save File attribute values shown above have been shortened for visual clarity. However, a fully-qualified path and file name, with .xml extension, is required, so a realistic attribute value would be something like:
@Function.AppPhysicalPath~\DashFiles\DashbdSave.xml
and the account the Logi application runs under would be given Write permissions to the "DashFiles" folder. For experimentation purposes, you can use the rdDownload folder, for which appropriate permissions already exist (but its contents are periodically deleted, so don't use it for anything but experimentation).
Dashboard Save Files are often named using a token, such as @Function.UserName~, in order to create personalized Dashboard configurations and, in that case, the Custom Dashboard Panel attribute would use the same token.
The Custom Dashboard Panel element has a new attribute, Add Caption, which sets the caption for the button used to save the Data Table or chart. If left blank, the caption is "Add to Dashboard". For more information about Dashboards, see Logi Info Dashboard .
Charts that utilize the Zoom feature can also be added to the Dashboard for future use. To enable, set the attribute Allow Zoom Control to "True".