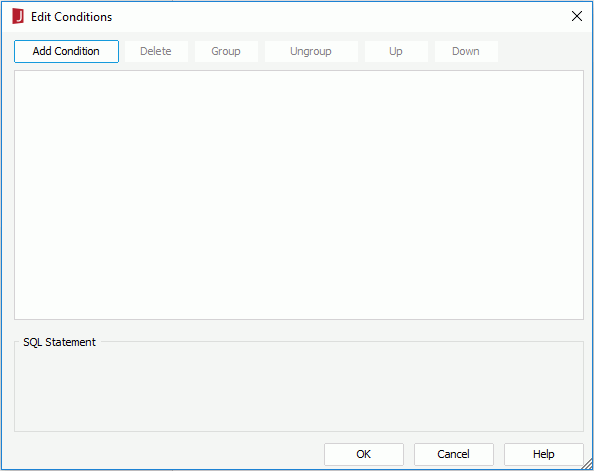
Edit Conditions Dialog
The Edit Conditions details and functions of the dialog vary according to different sources it is opened from.
If it is opened by selecting the button  or
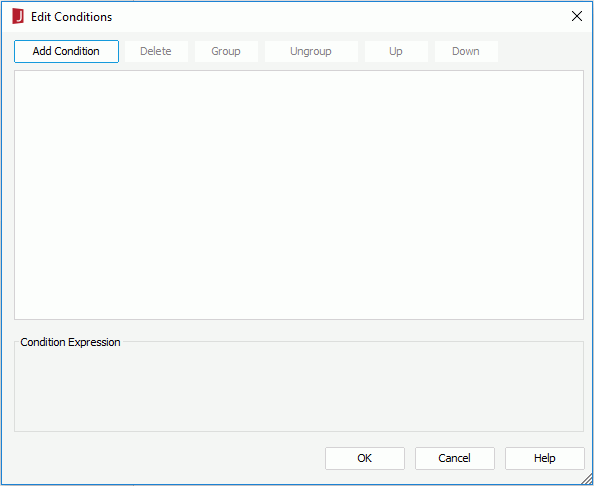
or  in the Conditional Formatting dialog, Insert Link dialog for page report or web report and library component, Edit Link dialog for page report or web report and library component, the Display screen of the Chart Wizard or Create Chart wizard for back-to-back bench chart in a query based page report, or selecting the Add or Edit button in the Shape Map Area Conditional Formatting dialog, it is used to add a new or edit an existing condition for the selected object. See the dialog.
The options in the dialog are as follows.
Add Condition
Adds a new condition line.
Delete
Deletes the selected condition line.
Group
Makes the selected conditions in a group. Conditions can also be added to an existing group by selecting the conditions and the group while holding the Ctrl button, and then selecting the Group button.
Ungroup
Makes the selected condition ungrouped.
Up
Moves the selected condition or group up to a higher level.
Down
Moves the selected condition or group down to a lower level.
Lists the logic operator.
- And
Logic operator And which is applied to this and the next line. - Or
Logic operator Or which is applied to this and the next line. - And Not
Logic operator And Not which is applied to this and the next line. - Or Not
Logic operator Or Not which is applied to this and the next line.
Field
Specifies the field on which the condition is based.
Specifies the operator to compose the condition expression.
- =
Equal to - >
Greater than - >=
Greater than or equal to - <
Less than - <=
Less than or equal to - !=
Not equal to
Value
Specifies the value of how to build the condition.
- If you are editing conditional link or conditional formatting on a field, you can either type in the value manually or select the value from the drop-down list, where the top 50 values of the selected field are listed.
- If you are editing conditional formatting on map areas, type in the value manually or select the button
 next to the value text box to specify the value.
Condition Expression
Displays the condition expression.
OK
Applies the changes and closes the dialog.
Cancel
Cancels the changes and exits the dialog.
Help
Displays the help document about this feature.
Related topics:
If it is opened by selecting  or
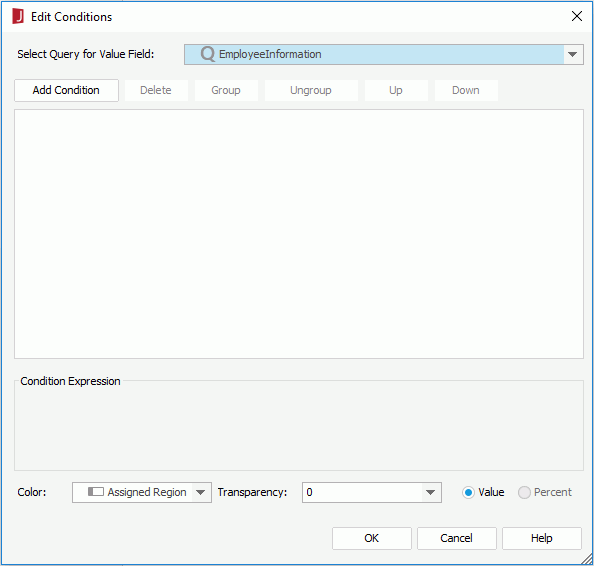
or  in the Fill tab of the Format Bar/Pie/Donut/Rectangle dialog when Use Single Color with Condition is selected, it is used to add more complicated conditional fill to the values of a chart. The options in the dialog are as follows. See the dialog.
Select Query for Value Field
Specifies the query which contains the fields you want to use as the values to build the condition.
Add Condition
Adds a new condition line.
Delete
Deletes the selected condition line.
Group
Makes the selected conditions in a group. Conditions can also be added to an existing group by selecting the conditions and the group while holding the Ctrl button, and then selecting the Group button.
Ungroup
Makes the selected condition ungrouped.
Up
Moves the selected condition or group up to a higher level.
Down
Moves the selected condition or group down to a lower level.
Lists the logic operator: And, Or, And Not, Or Not.
Field
Specifies the field on which the condition is based.
Specifies the operator to compose the condition expression: =, >, >=, <, <=, !=.
Value
Specifies the field in the selected query as the value to build the condition. You can also select <Input...> and input the value directly in the text box.
Condition Expression
Displays the condition expression.
Color
Specifies the color that will be applied to the chart values which meet the condition. Select a field in the specified query the values of which contain strings such as 0x000000 to control the color, or select <Input...> and input the value directly in the text box.
Transparency
Specifies the transparency of the color. Select a field in the specified query the values of which are integers between 0 and 100 to control the transparency, or select <Input...> and input the value directly in the text box.
Value
Specifies to display the data in the condition expression as value. The option is applied only when the field which the condition is based on is a value field or a field that returns a number.
Percent
Specifies to display the data in the condition expression in percent. The option is applied only to pie chart, 100% Stacked Bar/Bench 2-D chart and 100% Stacked Bar/Bench 3-D chart, and only when the field which the condition is based on is a value field or a field that returns a number.
OK
Applies the changes and closes the dialog.
Cancel
Cancels the changes and exits the dialog.
Help
Displays the help document about this feature.
If it is opened by selecting  or
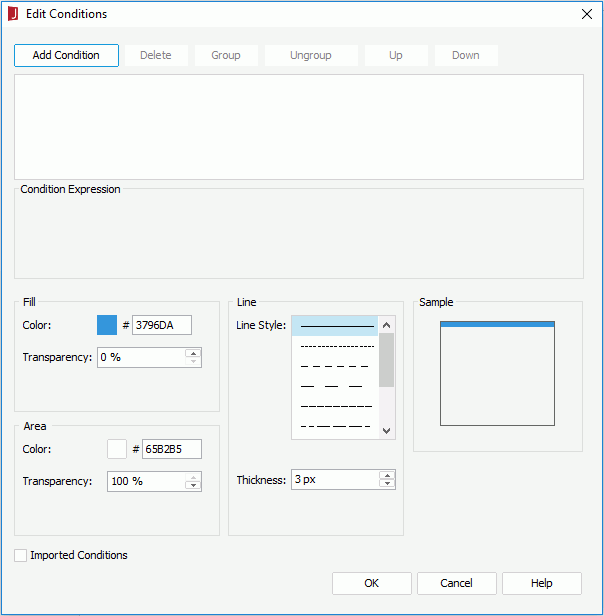
or  in the Fill tab of the Format Line dialog when Use Single Color with Condition is selected, it is used to add more complicated conditional fill to the values of a chart. The options in the dialog are as follows. See the dialog.
Select Query for Value Field
Specifies the query which contains the fields you want to use as the values to build the condition. Available when Imported Conditions is checked.
Add Condition
Adds a new condition line.
Delete
Deletes the selected condition line.
Group
Makes the selected conditions in a group. Conditions can also be added to an existing group by selecting the conditions and the group while holding the Ctrl button, and then selecting the Group button.
Ungroup
Makes the selected condition ungrouped.
Up
Moves the selected condition or group up to a higher level.
Down
Moves the selected condition or group down to a lower level.
Lists the logic operator: And, Or, And Not, Or Not.
Field
Specifies the field on which the condition is based.
Specifies the operator to compose the condition expression: =, >, >=, <, <=, !=.
Value
Specifies the value of how to build the condition. When Imported Conditions is checked, you can select a field in the specified query as the value to build the condition.
Condition Expression
Displays the condition expression.
Fill
Specifies the fill effect of the chart values which meet the condition. Disabled when Apply Color to Line in the Node tab of the Format Line dialog is checked.
- Color
Specifies the color schema.If Imported Conditions is unchecked, select the color image and select a color from the color palette, or input the hexadecimal value (for example, 0xff0000) of a color directly in the text box. When Imported Conditions is checked, select a field in the specified query the values of which contain strings such as 0x000000 to control the color, or select <Input...> and input the value directly in the text box.
- Transparency
Specifies the transparency of the color schema. When Imported Conditions is checked, you can select a field in the specified query the values of which are integers between 0 and 100 to control the transparency, or select <Input...> and input the value directly in the text box.
Area
Specifies properties for the areas that meet the condition, which are formed by the chart axes and the chart line. Applies to 2-D lines only.
- Color
Specifies the color schema. When Imported Conditions is checked, you can select a field in the specified query to control the color. - Transparency
Specifies the transparency of the color schema. When Imported Conditions is checked, you can select a field in the specified query to control the transparency.
Line
Specifies the line pattern of the chart values that meet the condition.
- Line Style
Specifies the style of the chart line. - Thickness
Specifies the line thickness, in pixels.
Sample
Displays a preview sample of your settings.
Imported Conditions
Specifies whether to use field values to build the condition and control the color and transparency properties values.
OK
Applies the changes and closes the dialog.
Cancel
Cancels the changes and exits the dialog.
Help
Displays the help document about this feature.
If it is opened by selecting  or
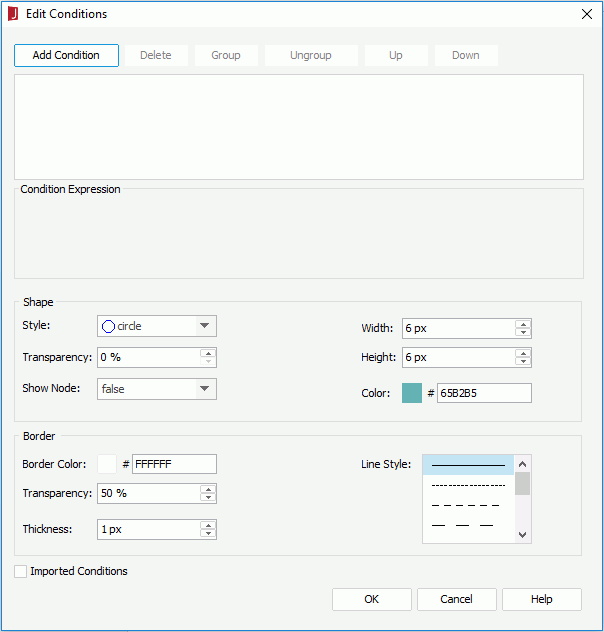
or  in the Node tab of the Format Line dialog when Use Single Color with Condition is selected, it is used to add more complicated conditional fill to the values of a chart. The options in the dialog are as follows. See the dialog.
Select Query for Value Field
Specifies the query which contains the fields you want to use as the values to build the condition. Available when Imported Conditions is checked.
Add Condition
Adds a new condition line.
Delete
Deletes the selected condition line.
Group
Makes the selected conditions in a group. Conditions can also be added to an existing group by selecting the conditions and the group while holding the Ctrl button, and then selecting the Group button.
Ungroup
Makes the selected condition ungrouped.
Up
Moves the selected condition or group up to a higher level.
Down
Moves the selected condition or group down to a lower level.
Lists the logic operator: And, Or, And Not, Or Not.
Field
Specifies the field on which the condition is based.
Specifies the operator to compose the condition expression: =, >, >=, <, <=, !=.
Value
Specifies the value of how to build the condition. When Imported Conditions is checked, you can select a field in the specified query as the value to build the condition.
Condition Expression
Displays the condition expression.
Shape
Specifies shape properties of the nodes the values of which meet the condition.
- Style
Specifies the style of the nodes. - Transparency
Specifies the transparency of the color schema. When Imported Conditions is checked, you can select a field in the specified query the values of which are integers between 0 and 100 to control the transparency, or select <Input...> and input the value directly in the text box. - Show Node
Specifies whether to show the nodes. When Imported Conditions is checked, you can select a field in the specified query the values of which are true or false to control it, or select <Input...> and input the value directly in the text box. Only when the property is set to true, the node related properties for the line chart can take effect. - Width
Specifies the width of the nodes, in pixels. - Height
Specifies the height of the nodes, in pixels. - Color
Specifies the color of the nodes.If Imported Conditions is unchecked, select the color image and select a color from the color palette, or input the hexadecimal value (for example, 0xff0000) of a color directly in the text box. When Imported Conditions is checked, select a field in the specified query the values of which contain strings such as 0x000000 to control the color, or select <Input...> and input the value directly in the text box.
Border
Specifies the border properties of the nodes the values of which meet the condition. Available when the node is not of the plus, multiplication, star1 or star2 style.
- Border Color
Specifies the border properties of the nodes. Available when the node is not of the plus, multiplication, star1 or star2 style. When Imported Conditions is checked, you can select a field in the specified query to control the color. - Transparency
Specifies the transparency for the border of the nodes. When Imported Conditions is checked, you can select a field in the specified query to control the transparency. - Thickness
Specifies the thickness for the border of the nodes, in pixels. - Line Style
Specifies the line style for the border of the nodes.
Imported Conditions
Specifies whether to use field values to build the condition and control values of some node properties.
OK
Applies the changes and closes the dialog.
Cancel
Cancels the changes and exits the dialog.
Help
Displays the help document about this feature.
If it is opened by selecting the button  in the Edit Values dialog. It is used to compose an expression for retrieving field values when configuring business view security. See the dialog.
The options in the dialog are as follows.
Add Condition
Adds a new condition line.
Delete
Deletes the selected condition line.
Group
Makes the selected conditions in a group. Conditions can also be added to an existing group by selecting the conditions and the group while holding the Ctrl button, and then selecting the Group button.
Ungroup
Makes the selected condition ungrouped.
Up
Moves the selected condition or group up to a higher level.
Down
Moves the selected condition or group down to a lower level.
Lists the logic operator: And, Or, And Not, Or Not.
Field
The field is read only.
Operator
Specifies the operator to compose the condition expression.
- =
Equal to - >
Greater than - >=
Greater than or equal to - <
Less than - <=
Less than or equal to - !=
Not equal to - [not] in
Causes an enumerated list of values to appear in the WHERE clause predicate, used for evaluating for a true condition. For operator "in" or "not in", multiple values separated by comma (,) are allowed. - [not] like
Like string pattern matching operator is used to compare the first expression string value to the pattern string (the second expression). If you want to use wildcard character in the pattern string, only "_" and "%" are supported. - [not] between
Allows the system to evaluate whether or not data values are located between a range of values indicated in the predicate. For operator "between" or "not between", there are two value text boxes for inputting the same type of values. - is [not] null
It is used in WHERE clause predicates to match null values occurring in a specified data field. For operator "is null" or "is not null", the value text box is hidden.
Value
Specifies the value of how to build the condition. You can either type in the value manually or select the value from the drop-down list, where the top 50 values of the selected field are listed.
When the field is based on a formula which references a parameter, the value list will be null. Parameters are not supported here.
SQL Statement
Displays the statement expression.
OK
Applies the changes and closes the dialog.
Cancel
Cancels the changes and exits the dialog.
Help
Displays the help document about this feature.
 Previous Topic
