Google Maps
The Logi Info Google Map element allows developers to include the geo-mapping features of the Google Maps web service in their reports and provides an opportunity to combine it with their own information to produce hybrid maps, sometimes called "mapmashups." This topic introduces the Google Maps web service and the Google Map element.
- What's a "Google Map"?
- What's a Web Service?
- System Requirements
- The Google Map Family of Elements
- Refreshing Google Maps
- About Mapping Data
What's a "Google Map"?
As mentioned above, a Google Map is an interactive geographic map that can be use your data to identify locations and provide other features. The concept is simple: take two different data sources (your data and Google's maps) and combine them into something that's more useful than the sum of their parts.
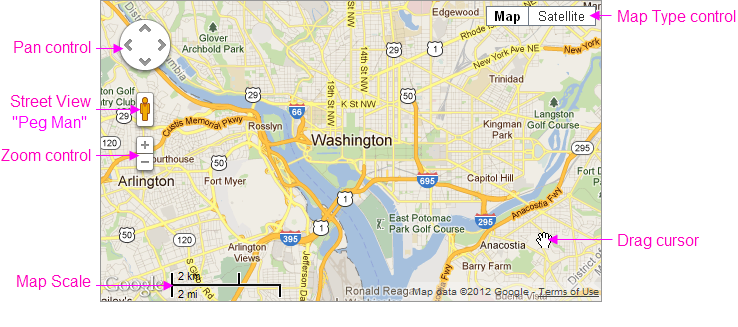
The example above shows a Google Map of the area surrounding Washington, D.C. It's a typical map depicting roads, major land features, and significant points-of-interest. The example also identifies the available optional controls, the scale for indicating map distances, and the cursor shaped that appears when dragging the map within its viewing area.
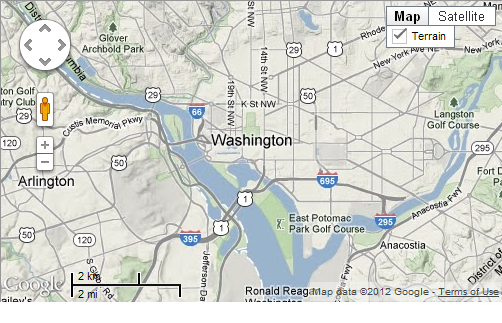
The example above shows the same map with the Terrain map type selected.
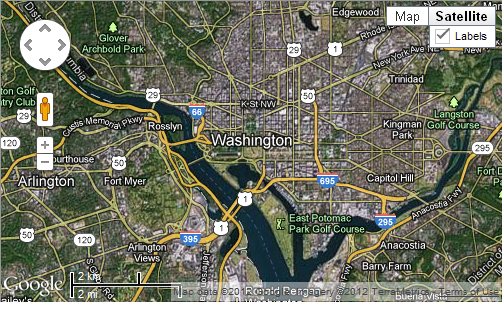
This basic example shows the same map with the Satellite map type selected.
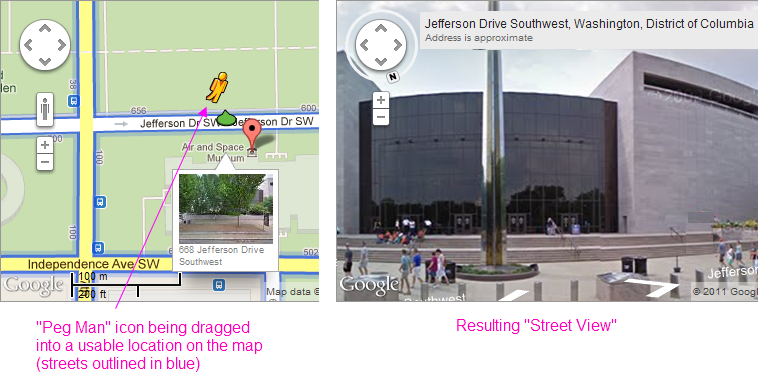
In "Street View" mode, Google Maps provide a street-level photographic view of a map area. Street View is engaged by dragging the "Peg Man" icon, as shown above, onto an enabled street (shown in blue when the icon is moved). Once dropped, the view switches to street-level and controls are presented allowing you to navigate and turn within the "virtual world".
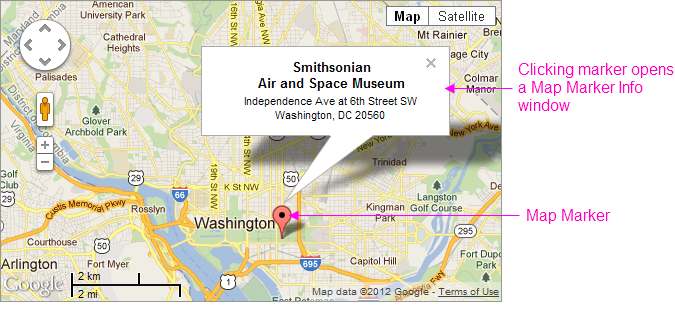
Now the basic map example includes a "mashup" of data. When identifying data is fed to the web service, the resulting output can pinpoint locations on the map. The example above shows how a geographic Map Marker is placed on the map to identify a specific location. Map Markers can use the default icon (shown) or a custom image, gauge, or even a chart. Optionally, the map can be configured to display a Map MarkerInfo window, containing additional location-specific data, when
the marker is clicked.
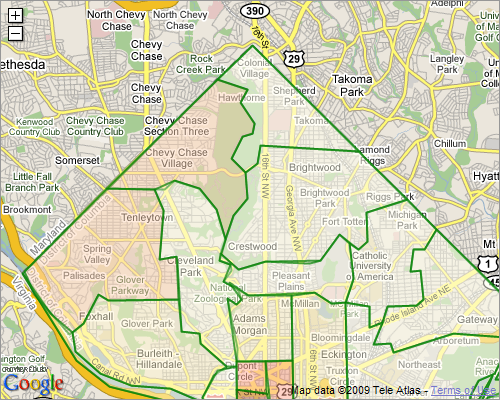
The example shown above includes data-driven, colored regions (in this case, representing postal codes) overlaid a map of Washington, DC. Logi Info can work with GIS boundary data to produce region overlays for states, counties, cities, school districts, and other areas. Like the Map Marker, regions can be clicked to display a pop-up information window with detail data.
Check out these interesting examples of Google Map mashups from around the world.
What's a Web Service?
The formal definition of a web service is "a software system designed to support interoperable, machine-to-machine interaction over a network". In plain terms, developers can think of a web service as a standard programming "function" that happens to be hosted on an external machine, one that your Logi app reaches over the Internet. You send it parameters and the web service sends you results, with the benefit that the whole process is language neutral.
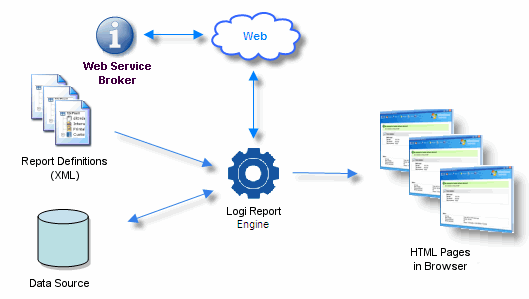
The diagram above illustrates how this fits into the Logi application architecture. Usually, the "parameters" that you send to the web service come from a database that your application queries. The results are used in the HTML pages that are output to a browser. Logi Studio elements make the process of connecting to, and communicating with, the web service very easy.
API Licensing and Use
Web service brokers, such as Google, make their web services available to Internet users, often for a fee. This means consumers of the services are obliged to sign up and pay, usually on a transaction-by-transaction basis.
![]() We're making the following license-related information and links available as a courtesy but, as Google's licensing plans may change without any notice to us, please understand that we don't guarantee that the information to be currently accurate. You, as the developer, are responsible for reviewing the current Google licensing requirements and for taking whatever actions are legally
necessary with regard to licensing.
We're making the following license-related information and links available as a courtesy but, as Google's licensing plans may change without any notice to us, please understand that we don't guarantee that the information to be currently accurate. You, as the developer, are responsible for reviewing the current Google licensing requirements and for taking whatever actions are legally
necessary with regard to licensing.
Google Maps licensing can be reviewed in this license comparison page. In general:
- The basic Google Maps web service is a free service, available to any web site that is free to consumers and publicly accessible.
- For public, commercial web sites that are not free to consumers, or to use the Google Map service on a private corporate intranet or in a application that is not publicly accessible, Google offers Google Maps API for Business licensing.
- Google also offers OEM licensing; see the bottom of the license comparison page.
Use this link to review the Google Maps Terms of Use.
As of Logi Info v10.0.455, our Google Map elements use the Google Maps Javascript API V3; prior Logi Info releases used the now-deprecated Google Maps API V2.
System Requirements
The Logi Studio Google Map element requires a Logi Info license; it's not available in Logi Report. In addition, when your finished application runs, it needs to be able to access the Internet in order to interact with the Google web service, which means there may be firewall and security implications for you to consider.
Note that Google Maps maps can only be used within HTML, so they cannot be exported to other formats such as PDF or Word.
The Google Map Family of Elements
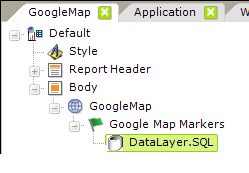
A number of Logi Studio elements make up the family used to create Google Maps. Each element, its function, and its attributes are discussed below:
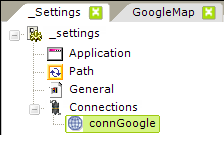
| Connection.Google Maps - This special type of Connection element is only necessary for communicating with the web service if you're using a Premiere or enterprise license. Like all connection elements, it resides in your _Settings definition. Attributes include:
|
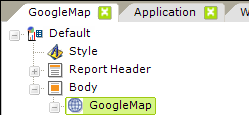
| Google Map - The root element for implementing a Google Map in your report. Attributes include:
|
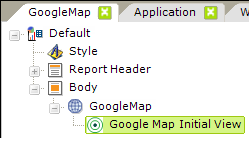 | Google Map Initial View - (v10.1.18+) Allows you to optionally set the initial Zoom Level and geographic location the map will open to when the page is first displayed. Attributes include:
|
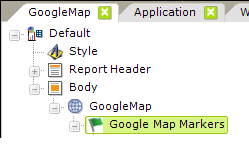
| Google Map Markers - Map Markers appear on the map to pinpoint a location, based on latitude and longitude positioning values. The graphic image for the marker can consist of an image, chart, or gauge; a default image is provided. Attributes include:
You can add Action elements below this element so that when a user clicks a marker, an information panel appears or another report is shown. |
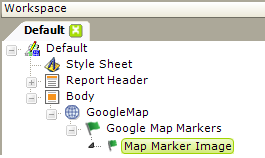 | Map Marker Image - This optional element is a container for one Image, Gauge, or Chart element that provides the image for the Map Marker element. If this element is not included in the definition, the default marker image is used. The default image is:
Data can be used here in interesting ways. For example, an image caption (image file name) and the image size can be data from the datalayer (their values can be @Data tokens), so locations can be differentiated visually based on their data. The marker image can also be an actual gauge or chart which would also immediately differentiate locations based on their data. |
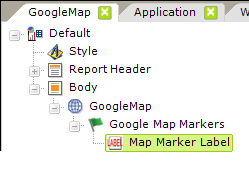 | Map Marker Label - This optional element allows you to define a label that will appear under the marker. The label can be styled most easily by defining a CSS class. Its attributes are Caption and Class. |
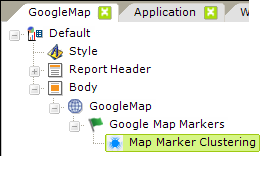 | Map Marker Clustering - (v10.0.455+) When present, this optional element will group markers into clusters according to their distance from a cluster's center. When a marker is added, the marker cluster will find a position in all the clusters or, if it fails to find one, will create a new cluster with the marker. The number of markers in a cluster will be displayed on the cluster marker. Clusters will break apart into individual markers when the mapped is zoomed-in sufficiently. This element has no attributes. |
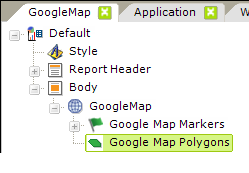 | Google Map Polygons - Google Map Polygons are regions plotted onto a map and are optional. They can be semi-transparent and have colors that are based on data values. Polygons are plotted from sets of latitude and longitude points. These typically come from a DataLayer.Gpx File or DataLayer.Kml File element.
You can add Action elements below this element so that when a user clicks a polygon, an information panel appears or another report is shown. |
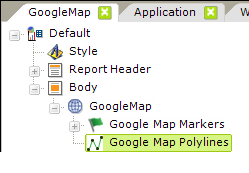
| Google Map Polylines - Introduced in v10.0.455, Google Map Polylines are lines plotted onto a map and are optional. They can be semi-transparent and have colors that are based on data values. Polylines are plotted from sets of latitude and longitude points. These typically come from a DataLayer.Gpx File or DataLayer.Kml File element.
You can add Action elements below this element so that when a user clicks a polygon, an information panel appears or another report is shown. |
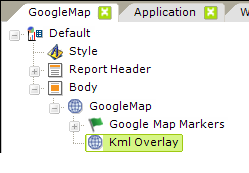 | KML Overlay - The KML Overlay element allows display of one or more KML files as overlays on the Google Map and is optional. When an overlay is used, the boundary viewport (location and zoom) are set according to the last KML file in the list.
|
| DataLayer Element - Datalayer elements are used as usual for any data retrieval operation and can have Group Filters, etc. as child elements to shape the data. Any type of datalayer element can be used. The data for this purpose should include at least some combination of the following (see About Mapping Data, below):
|
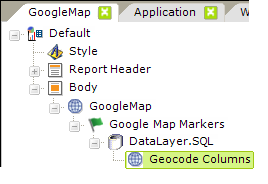
| Geocode Columns - This optional element is used if your database does not already include positioning data. It accepts address data and, via the Google web service, attempts to retrieve latitude and longitude values ("geocoding") for each record in the datalayer. The values are placed into two columns, named "Longitude" and "Latitude", that are added to the DataLayer. Without a specific license, this element will work for a time- and rate-restricted volume of requests. Customers can secure a "Google Maps API for Business" license to alter or remove these restrictions (see the API Licensing section) when using the Connection.Google Maps element's Google Maps Client ID and Private Key attributes (added in v11.0.519). Follow this link for a list of the countries for which Google currently provides geocoding. Other web service brokers also provide geocoding in other countries. Element Attributes include:
|
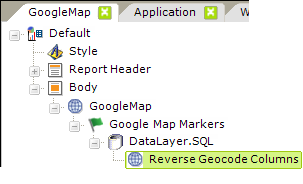 | Reverse Geocode Columns - (v10.0.455+) This optional element is used to produce address data from geographic coordinates. Values returned are put into columns that are added to the datalayer, using these column names: Attributes include:
|
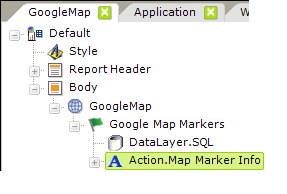
| Action.Map Marker Info - This optional element adds click event processing to the Google Map Markers element. When a map marker is clicked, processing flow continues with this element's child elements. Attributes are:
|
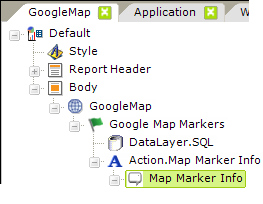
| Map Marker Info - This optional element represents the pop-up "balloon" that appears over the map when the parent Map Marker is clicked. A wide variety of elements, forming a virtual sub-report, can be placed as children below this element. These can include images, charts, links, data, and more. The data from the row associated with the clicked marker is available to the children of this element. (see the example image below). |
Refresh Google Maps
Developers may want to refresh their Google Maps with new data, either automatically or in response to user input. To do this, you can, of course, use an Action.Report element to refresh the entire report page.
Or if you want to refresh just the map, not the entire page, you can place your Google Map in a separate report definition and include it in your original report as a subreport using the SubReport element. Make the SubReport element the target of an Action.Refresh Element or Refresh Element Timer element and don't forget to use Link Parameters under the SubReport to pass any necessary values to the Google Map.
![]() A Google Map element is not usable as a direct target of an Action.Refresh Element or Refresh Element Timer element; not even if you wrap the map in a Division.
A Google Map element is not usable as a direct target of an Action.Refresh Element or Refresh Element Timer element; not even if you wrap the map in a Division.
About Mapping Data
Data used for Google Maps typically contains, at the least, address information. When this information is sent to the web service, the map generated will be scaled to fit the data into the dimensions you set for the map (in the Google Map element).
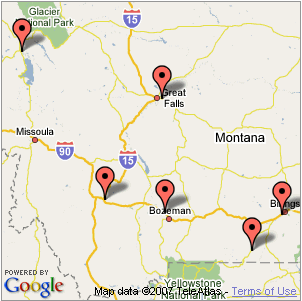
For example, if your data only includes state/province information for a single state, the map generated will be scaled to show as much of the state as necessary to include all of the map markers (above, left). This could be the result, for example, of a SQL query statement that includes a WHERE State = 'MT' clause.
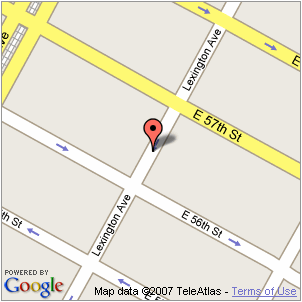
However, if your data includes street address, city, and state/province information, the map generated will be scaled as a street-level map (above, right). This could be the result, for example, of a SQL query statement that includes a WHERE City = 'New York' clause.
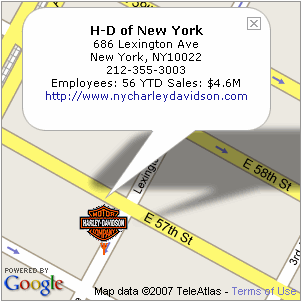
As shown above, one of the benefits of the interactive nature of these maps is that you can display additional information when the map marker is clicked. So, your data might include business intelligence data in addition to the address information. For example, revenue figures or employee counts. This data can be displayed, as in the example, in the Info Window that pops up when a marker is clicked. The Info Window can also contain images, charts, gauges, sub-reports, and links, all driven by data.
If your data already includes latitude and longitude positioning data, so much the better. The use of Geocode Column elements to provide that data involves additional "trips" to the web service and, depending on the service broker's agreement, that could mean additional transaction fees. In addition, at the time of this writing, Google imposes a geocoding limit of 2,500/day (using free service) or 100,000 day limit (Premiere API license) or enterprise users may have other contractual limits.. See the Google Maps Geocoding Usage Limits for more information.
![]() Support for data that includes "MultiGeometry" tags is included.
Support for data that includes "MultiGeometry" tags is included.
This concludes this introduction to Google Maps. For additional information, please see our Google Map Tutorial.
