Google Map Tutorial
This topic walks developers through building a sample application using the Logi Info Google Map element. You are highly encouraged to read Google Maps first, in order to get a basic understanding of the topic before proceeding. Steps in this tutorial include:
- Requirements Checklist
- Create the Basic Application
- Configure the Web Service Connection
- Create a Basic Google Map
- Add Interactive Features
- Geocode Data
- Reverse Geocoding
- Add an Info Window
- Add the Finishing Touches
Requirements Checklist
Before starting this tutorial you should be sure that:
- You're using Logi Info. The Google Map-related elements are not available in Logi Report.
- You're using Logi Info v8.0.29 or later. If you have an earlier version, please upgrade.
- You've reviewed the Google Maps Terms of Use and have a Google Maps API Premiere license if you need one.
- You've downloaded these sample data files and have unzipped them to a temporary location. The files are:
HD_Dealers.xml
HD_BarShield.gif
BikeShops.xml
BikeShops.gif
- You can connect to the Internet (outbound and inbound) from your development web server.
- You're familiar with the general steps for creating a new Logi application and for accessing databases to retrieve data.
If any of the above items are incomplete or missing, please take care of them before proceeding.
Create the Basic Application
Let's get started by building your Google Map application and placing the sample data appropriately:
- In Logi Studio, create a new application and register it with IIS. Test it to ensure that it works.
- Extract all four files from the sample data .zip file and save them in the _SupportFiles folder under your Logi application project folder.
Configure the Web Service Connections
If you're using a Google Premiere or enterprise license, this application will need one data connection for the Google web service. If you're using the regular, free web service, skip this step.
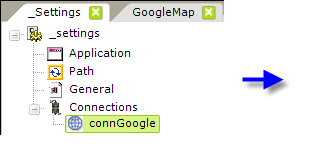
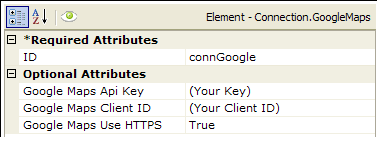
- In Studio, go to your _Settings definition and select the Connections element.
- Beneath it add a Connection.Google Maps element and configure its ID attribute, as shown above.
We don't need any other connections for this tutorial: you're going to create sample Google Maps using data from two different XML data files, which do not require them.
Creating a Basic Google Map
Now, with just a few quick steps, you'll produce a functional Google Map. The map will show you the locations of Harley-DavidsonMotorcycle Dealerships in the state of Illinois:
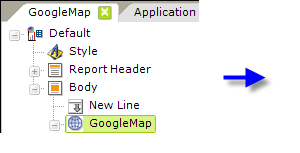
- In Studio, select your Default report definition.
- Add a New Line element under the Body element, and set its Line Count attribute to 2.
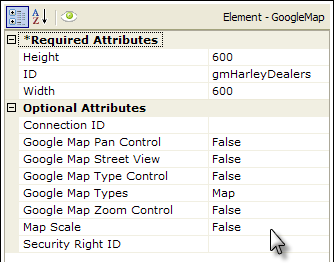
- From the Charts, Gauges & GIS Maps element list, add a Google Map element and configure its attributes as shown above. If you're using a Connection.Google Maps element, enter its ID in the Connection ID attribute.
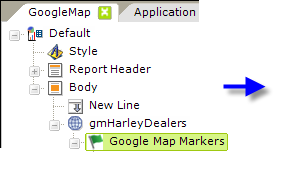
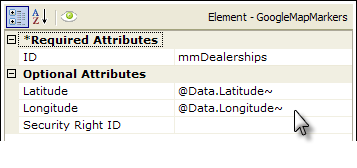
- Add a Google Map Markers element below the Google Map element and configure its attributes as shown above. The sample database you're working with includes columns named "Latitude" and "Longitude", which contain positioning data. Later on, you'll discover how to get that data from Google if you don't have it.
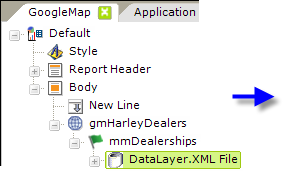
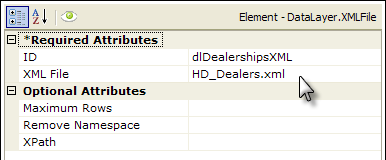
- Add a DataLayer.XML File element below the Google Map Marker and configure its attributes as shown above. The XML data file should be in the drop-down list of choices for this attribute.
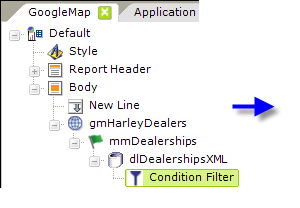
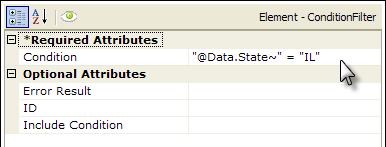
- Finally, add a Condition Filter element beneath the datalayer, as shown above, and set its Condition attribute as shown, to filter out all records except those where the State column equals "IL", the postal abbreviation for Illinois.
Now you're ready to create your first Google Map. Save and browse your application. The results should look something like this:
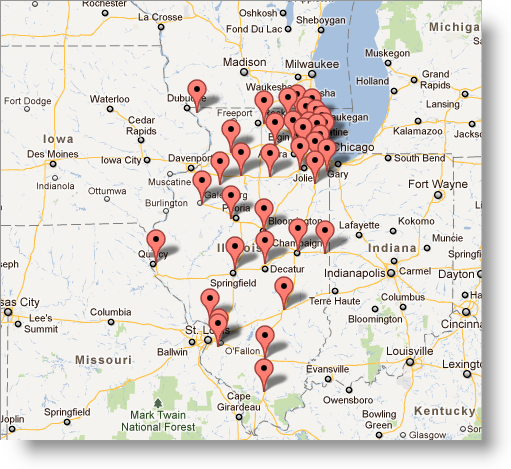
At this point, take some time to play with this map:
- Change the Condition Filter element's Condition attribute to get data for a different state or city ("@Data.City~" = "Chicago", for example) and notice how the map scales to the data.
- Note that your cursor is a "hand" when it's over the map, meaning that you can pan the map by dragging the cursor. Give it a try!
- Change your Google Map element's Height and Width attributes and see what happens to the map scale.
Now we can build on and extend our basic Google Map. This part of the tutorial includes these topics:
- Add Interactive Features
- Geocode Data
- Add an Info Window
Add Interactive Features
There are several ways to customize your map to make it more interactive. First, ensure that you change the Condition Filter element's Condition attribute to get data for Chicago only ("@Data.City~" = "Chicago").
Put Controls on the Map
You can make your map more interactive by adding user controls to it:
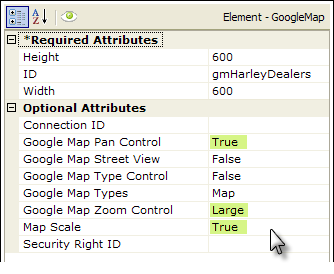
Revisit your Google Map element and set its Google Map Pan Control, Google Map Zoom Control, and Map Scale attributes as shown above.
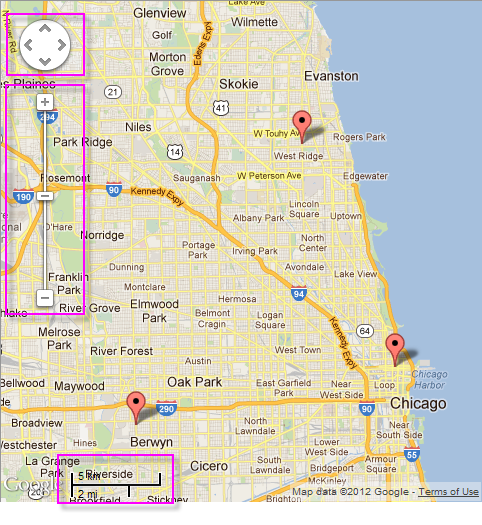
Save and browse your application. The map should now include Pan and Zoom controls and a Scale legend, as shown above. Try out the Zoom and Pan controls - they're actually a lot of fun to use!
Switch Between Map Types
The Google Map has other maptypes available: a terrain map, a satellite image, and a hybrid combination of the satellite image overlaid with the street map. These can be selected at runtime by the user if you add the proper controls:

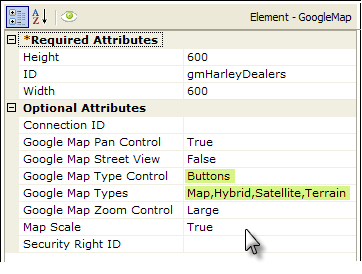
Go back to your Google Map element again and set its Google Map Types attribute as shown above.

Save and browse your application. The map should now include the buttons shown above, which allow the user to switch between map types. Click the buttons and see what happens. Note that some of the map types are selected using checkboxes that appear when you click a button.
Display a Custom Map Marker
The map of Harley-Davidson dealerships we created earlier can be enhanced by changing the graphic used to indicate locations on the map:
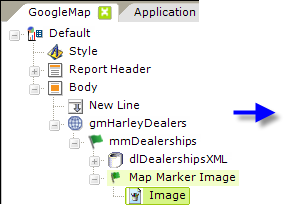
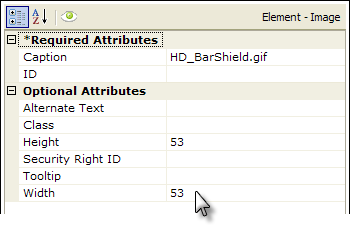
- In your definition, beneath the Google Map Markers element ("mmDealerships"), add a Map Marker Image element. This element has no attributes.
- Beneath it, add an Image element and set its attributes as shown. The image is from the data .zip file you downloaded earlier. A Height and Width value is required when using an Image element in a Google Map.
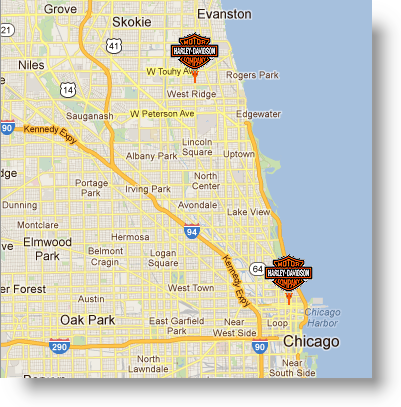
Save and browse your application, and see that the stock map marker has been replaced by the custom image, as shown above. Naturally, you have to exercise some caution when designing the size of alternate marker images so that you don't completely hide the map behind them.
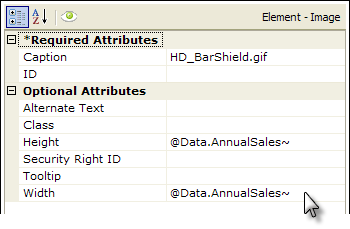
Speaking of size: you can cause the marker image itself to convey relative data by setting its Height and Width attributes to some value from your database. In the example above, the token for a sales revenue data column (just an example here, it's not in the sample data) is used in the attribute values. The images on your map will then appear larger or smaller based on the data, allowing an easy visual comparison.
Geocoding Data
So far, you've been working with a sample database table that includes address information and positioning data (latitude and longitude).
But what if you're working with a database that doesn't have that positioning data? Most location-oriented databases only have address information such as street address, city, state, and zip code. Well, if you have address information or place names, you can use a Google Map "helper" web service to get the positioning data. Even partial address data, such as zip codes alone, can result in useful positioning data.
The way this works is: you send your address information to the helper service and it will return it with the positioning data (if it can find it) appended. Practically, what happens is that your datalayer gets two columns added to it, with default names "Longitude" and "Latitude". This process is called "geocoding". The following exercise will show you how it's done.
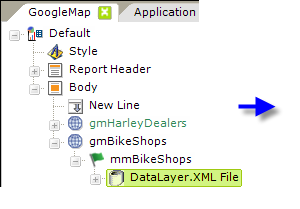
- In Studio, first go to your _Settings definition and select the General element. Set the value for the Debugger Style attribute to DebuggerLinks.
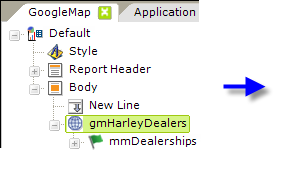
- In your main report definition, remark your gmHarleyDealers Google Map element and add a new Google Map element to your definition, as shown above. Except for the Element ID, set its attributes to match those of the remarked Google Map element.
- Beneath the new Google Map element, add a Google Map Markers element, as shown above. Except for the Element ID, set its attributes to match those of the remarked Google Map Markers element.
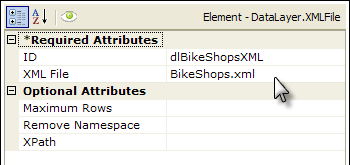
- Beneath that element, add a Datalayer.XML File element and set its attributes as shown above. It will use one of the .xml from the data .zip file you downloaded earlier.
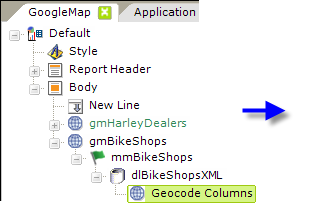
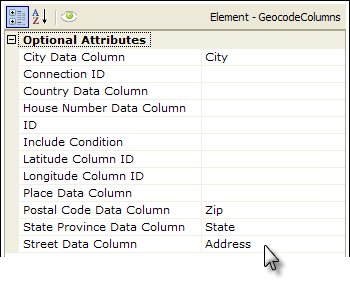
- Add a Geocode Columns element beneath the datalayer and set its attributes as shown above. If you're using a Connection.Google Maps element, enter its ID in the Connection ID attribute.
Also, notice that there are attributes for the Latitude and LongitudeColumnIDs; these default to "Latitude" and "Longitude", which also happen to be the names of the columns that the Google service appends to your data. Therefore, you can leave them blank.
There's also a Place Data Column attribute. This is used if you don't have address data but instead have the names of points-of-interest, such as "Washington Monument" or "Brooklyn Bridge".
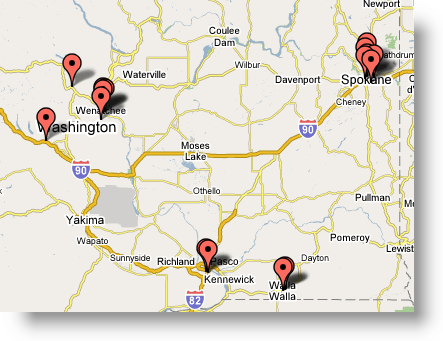
Save your changes and browse the application. Your map of bicycle shops in Washington State should look like the image shown above.
Let's look at what the geocoding process actually did: click the Debug this page link at the bottom of your map page. Your map page will be replaced with the Debugger Trace page.

Look down the page and, in the Event column, find the Get DataLayer - XMLFile entry, as shown above. Look in the next column for the DataLayer for ElementmmBicycleShops entry and then click the View File Stream Data link that's beside it, as shown above.
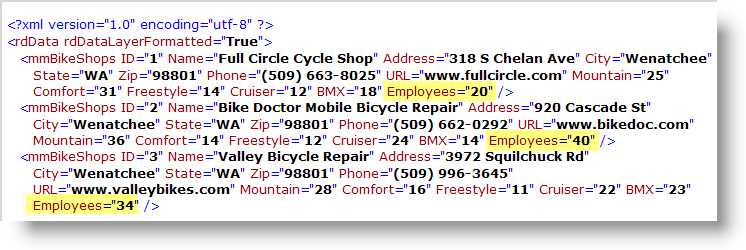
You should see the data, in XML format, that was retrieved into your datalayer from the data file. Notice that the last column in each record is "Employees". This is what the data was like before it was sent off to be geocoded.

Use your browser's Back button to return to the Debugger Trace page. Look down the Object column for the GeocodeColumns entry and click the View Memory Stream Data link beside it, as shown above.
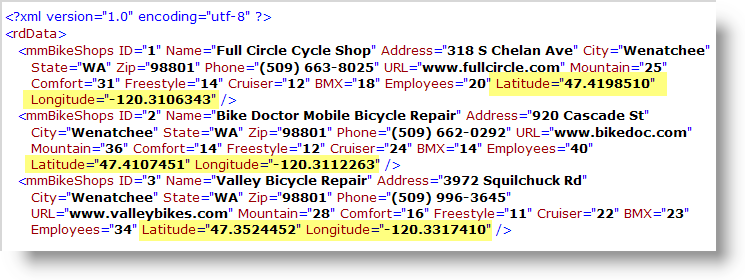
You should see the data, in XML format, that was returned by the Google Map service back to your datalayer. Notice that two new columns, Latitude and Longitude, with positioning data have been added to each record by the service.

Use your browser's Back button to return to the Debugger Trace page again. Look down the Event column for ** WARNING ** messages. You can see here what happens in the trace when an address can't be geocoded. In the next column, you can also see why: there's an extra comma delimiter in the data.
Geocoding is a slick way of getting positioning data based on your address information! However, keep the following in mind:
- Each data record submitted for geocoding is considered a "transaction" and counts against your daily allotment as described in the terms of your license with Google.
- Geocoding takes time; the more records to be processed, the longer a delay the user faces so, for example, geocoding the London telephone book in real time is not recommended.
- in your address data not only take geocoding time but the failed attempts still count as transactions, so it's in your interest to have your address data be as clean and accurate as possible before geocoding.
- The Google service also "throttles" geocoding requests to keep itself from being overwhelmed and generally returns an Error 620 if too many requests are received too quickly. The threshold is described in the terms of your license with Google.
The Include Condition Attribute
Beginning in v10.0.319, the Geocode Columns element has an Include Condition attribute. If the value of this attribute is left blank or contains a formula that evaluates to True, the element is utilized with the map. If the value evaluates to False, the element is ignored. This feature allows developers to dynamically switch between different sets of geocoding data.
Reverse Geocoding
Suppose you have the opposite location data situation from the one discussed above: you have the positioning data but not the address information. A typical use-case would be a mobile device app that "knows" its own GPS coordinates and needs to display the address.
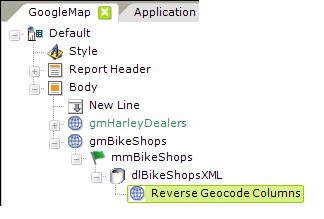
An element introduced in v10.0.455, Reverse Geocode Columns, allows you to feed positioning data to the Google web service and retrieve address information. The web service will attempt to append and return data for the following columns into the datalayer: StreetNumber, StreetName, Locality, Sublocality, AreaLevel1, AreaLevel2, AreaLevel3, Country, Latitude, Longitude, and PostalCode.
Add an Info Window
You're now ready to add even more interactivity to your Google Map. The Info Window allows you to provide detailed information when users click map markers. Disclaimer: While the stores used in this database are real, the data about them is fictional.
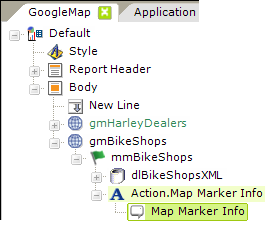
- In your definition, add an Action.Map Marker Info element beneath your Google Map Marker element ("mmBikeShops"). It has no attributes that need to be set.
- Beneath it, add a Map Marker Info element. It, too, has no attributes that need to be set.
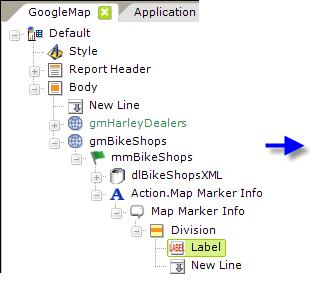
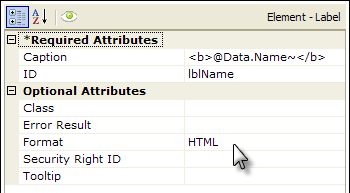
- Beneath the MapMarkerInfo element, as shown above, first add a Division element, setting its Class attribute to ThemeAlignCenter and its Output HTML Div Tag attribute to True. Then, beneath it, add a Label element and a New Line element. Set the Label's attributes as shown above; no attributes need to be set for the New Line element. Note the use of HTML formatting to make this label caption appear in boldface.
| ID | Caption | |
| lblAddress | @Data.Address~ | |
| lblCityStateZip | ="@Data.City~" +", " + "@Data.State~" + " " + "@Data.Zip~" | |
| lblPhone | @Data.Phone~ | |
| lblEmployees | # of Employees: @Data.Employees~ | |
| lblURL | @Data.URL~ |
- Add five more Label elements and four New Line elements to separate them beneath the Division. Use the information shown above to set the Label elements' attributes (but leave their Format attributes blank this time).
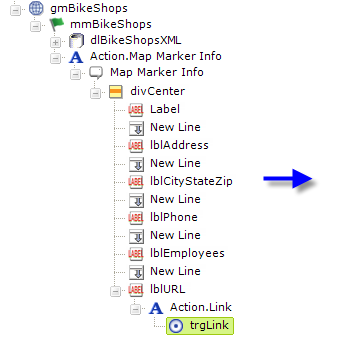
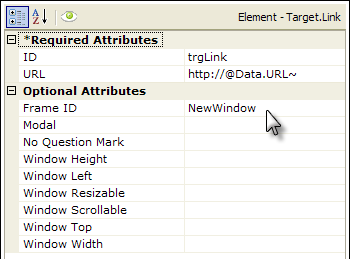
- Finally, beneath the last Label element (lblURL) add an Action.Link and Target.Link element as shown above. Set the Target.Link element's attributes as shown above.
Save your application and browse it. Now, when your map appears, click one of the map markers. You should see something like this:
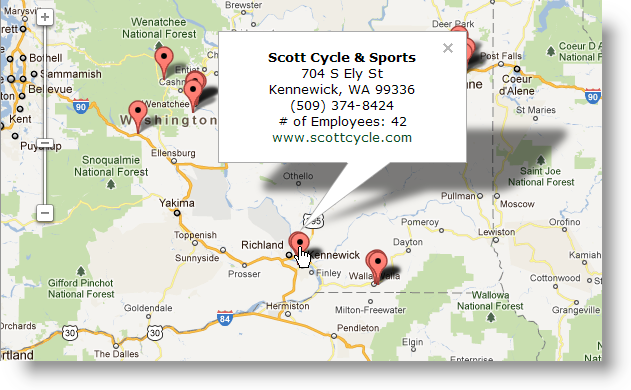
Click on different map markers. As you can see, the Info Window is displayed with data from the database for each store when you click on its marker. You can also click on the store URL in the Info Window to go to their web site in another browser window. Other Action-type elements could be used in your definition to redirect users to Logi application detail reports, processes, etc.
Add the Finishing Touches
To finish your map of bicycle shops, let's add two final flourishes. First, add a custom map marker image:
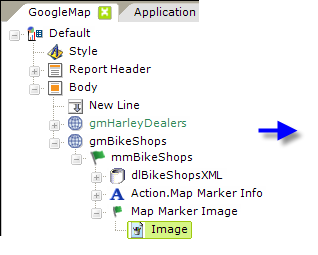
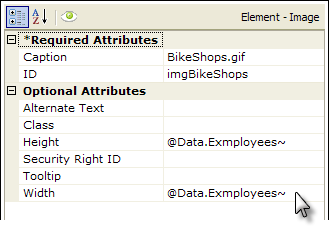
- Beneath the Google Map Markers element ("mmBikeShops"), add a Map Marker Image element and, beneath it, an Image element. The Map Marker Image element has no attributes; set the Image attributes as shown above. Note that you're setting the size of the custom image to the employee count data from the database, so shops with more employees will have a larger image.
Let's test that concept. Save your application and browse it. You should see something like this:
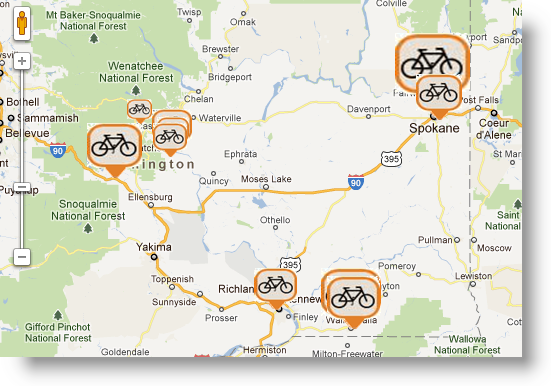
Click the images and compare the number of employees reported in the Info Window. Do marker sizes reflect the relative employee counts?
Finally, let's add a pie chart to the Info Window. Note that this operation requires use of a database and cannot be achieved using the sample XML data used in this tutorial.
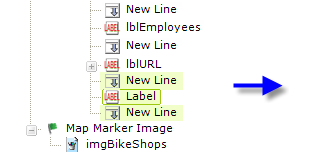
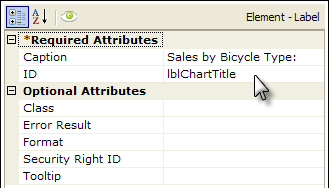
- Beneath the MapMarkerInfo element, add a New Line element, a Label element, and a New Line element as shown above. Set the New Line elements' Line Count attribute to 2. Set the attributes for the Label element as shown above.
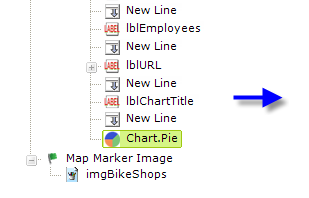
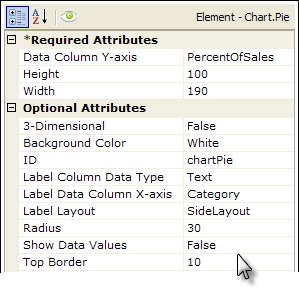
- Add a Chart.Pie element and set its attributes as shown above (blank attributes have been removed to save space).
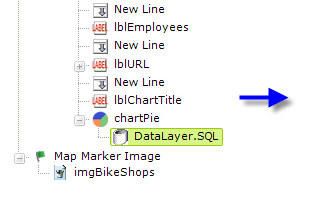
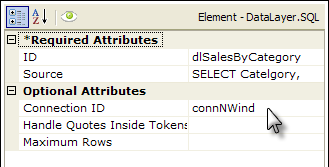
- And, finally, add a DataLayer.SQL element beneath the Chart element and set its attributes as shown above. The complete SQL query for the Source attribute will be similar to:
SELECT Category, PercentOfSales FROM SalesData Where ID = @Data.ID~
The @Data.ID~ token is a column value from the original datalayer used at the top of your definition.
Save your application and browse it. Click on a map marker and you should see something like this:
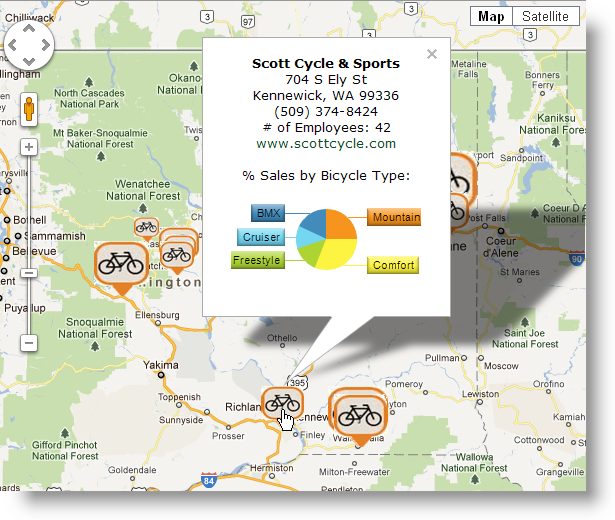
Congratulations, you've successfully completed this Google Maps tutorial. You've seen how to connect to the Google Maps web service, how to plot data on the map, how to add interactive map controls, how to geocode address data, and how to use the Info Window. Happy mapping!