Google Map Polygons
Logi application developers who have used Google Maps to provide geographic mapping solutions can take advantage of another Logi Info feature, the ability to overlay color-coded polygons on a map, for enhanced reporting. This topic discusses this feature.
- About Google Map Polygons
- About the Data
- Create a Google Map with Polygons
- Add Drill-down Capabilities
- Tools for GIS Data Conversion
- Use Data from SQL Server
- GIS Data Resources
About Google Map Polygons
Google Map Polygons, plotted onto the map, are overlays that can be different colors based on data
values. Here's an example:
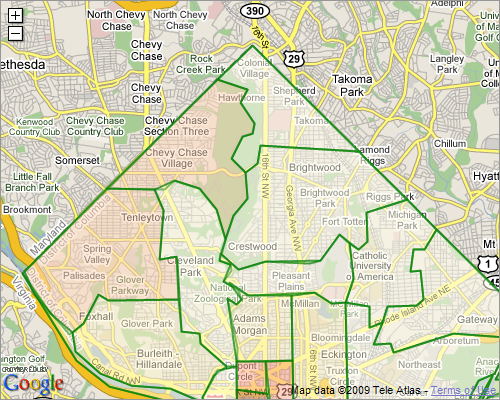
This map shows the northern half of Washington, D.C. with polygons representing different postal codes overlaid on it. The color of the polygon denotes the number of banks located within it. The polygons have been configured to be semi-transparent, so that geographic features, such as streets, can be seen through them.
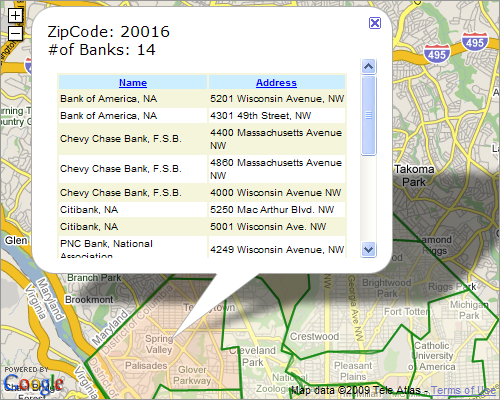
Polygons function like traditional Google Map Markers and can be related to other data, so that when they're clicked, a popup information panel is displayed, as shown above, that contains more detailed information. Both polygons and map markers can be used in the same map.
Other examples of geographic polygons include political boundaries (such as states, counties, and cities), school districts, voting districts, and water management districts, to name but a few.
Geographic Area Boundary Data
Polygons are plotted using sets of latitude and longitudepoints that describe the boundaries of geographic areas. For use with Logi elements, these typically come from GPX or KML files, which are GIS industry standard XML data files. Special datalayers are provided in Logi Info to read these files. Because of the public nature of many of these geographic areas, their boundary data is often freely available on the Internet.
Area boundaries are also widely available in shapefiles, a popular geospatial vector format for GIS data. Free and inexpensive software tools, discussed in a later section, are available for converting shapefiles into GPX or KML data files.
Geographic data can also be retrieved from SQL database tables using DataLayer.SQL - see the section on the next page for more information.
General Features
The following describe additional features of Google Map polygons:
- Borders, fill colors, and transparency level are all configurable and may be set from data values.
- Colors may be set in steps or as smooth color spectrums based on minimum and maximum data ranges.
- Polygons may be included or excluded based on data values.
- Polygon resolution is adjustable, and is dynamically sharpened as the user zooms the map in or out.
- Maps are initially displayed at a location and zoom level that shows all polygons.
- A special color spectrum legend element can be displayed below or alongside the map.
The examples discussed in this topic are available on DevNet for download as the Google Map Regions Sample Application.
About the Data
The following example will demonstrate how to create a Google Map with polygon regions overlaid on it. The purpose of the example is to create a map of the state of Florida, with an overlay of all its public school districts, in order to easily compare "dropout rates" - the percentage of students who have dropped out of the school system - in the 2007-2008 school year. As is often the case, the first step is to have a look at the data.
For this example, relevant annual dropout rate data from the State of Florida's Department of Education has been downloaded and stored as an XML data file.
|
A sample of the XML dropout data is shown above; note that the field District contains the school district name values.
|
Similarly, GIS data defining the boundaries of the state's school districts has been download and stored as a GPX file and a sample of it is shown above. Note that the school district name is part of the data in the desc field. The beginning of the latitude and longitude data for the district boundaries is at the bottom of the sample.
In our Logi application, we'll relate the school district names in these two files with each other in order to make our map overlay functional.
The format of a KML file is somewhat different but it's still XML data and you can look at it easily enough to determine relevant field names.
Create a Google Map with Polygons
Before starting to create an application that uses Google Maps, the developer must get a Google Maps API Key to access the mapping web service. Google Maps provides information about getting an API Key. The example begins below with the assumptions that an API Key has been secured and that a Connection.GoogleMaps element has been configured with it in the _settings definition.
- In your report definition, add and configure a Google Map element to use your Google Map connection.
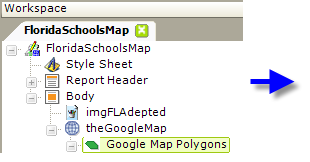
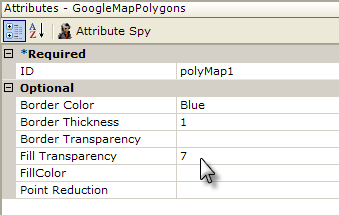
- Beneath it, add a Google Map Polygons element, as shown above. This configures the polygons that will overlay the map and its Border and Fill attributes affect the appearance of the polygons. We'll come back later to set the Fill Color attribute.
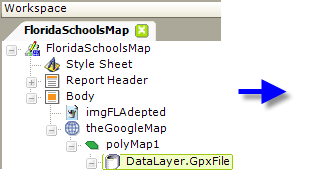
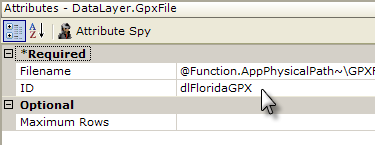
- Beneath the polygon element, add a DataLayer.GpxFile element, as shown above. This element directly reads the GPX file examined earlier that contains the GIS data defining the boundaries of the state's school districts. If you're working with KML files instead, there's also a DataLayer.KmlFile element for reading them.
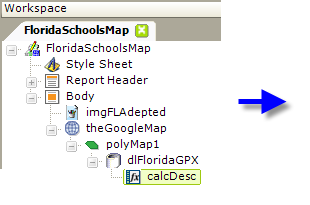
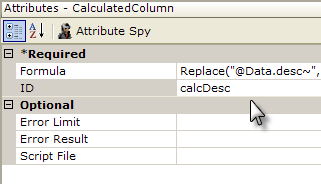
- Beneath the datalayer, add a Calculated Column, as shown above. This column is used to compensate for the fact that the school district names are formatted differently in the two data files examined earlier. The complete formula attribute value is:
Replace("@Data.desc~", " COUNTY SCHOOL DISTRICT", "")
which truncates the data, creating an additional datalayer column that contains only the district name.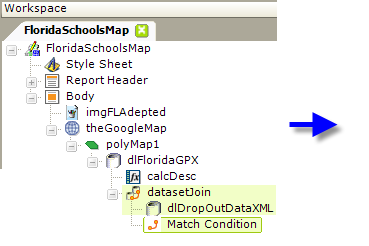
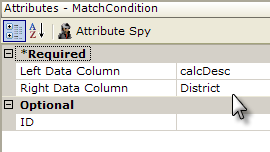
- Next, add a Join element, a DataLayer.XML File element and a Match Condition element, as shown above. The Join element is configured as an Inner Join and the datalayer retrieves data from the XML file with the dropout data we examined earlier. The Match Condition element is configured as shown above, relating the District column in the XML file with the calculated column calcDesc created in the previous step from the GPX file.
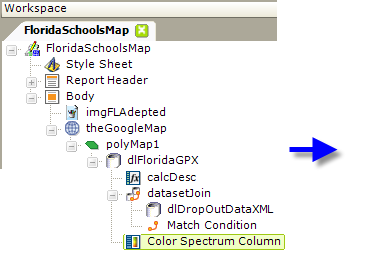
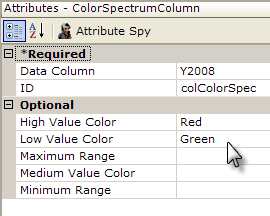
- Select the DataLayer.GpxFile element ("dlFloridaGPX") and, beneath it, add a Color Spectrum Column element, as shown above. This column will contain the color value for each row in the datalayer, determining the color for each polygon on the map.
The Data Column attribute value will be the name of the column with the data for the year we want to compare, 2008, and the color attributes are set to provide a color that ranges between Red and Green based on the dropout rate. Make a note of its ID attribute value, which will be used in the next step.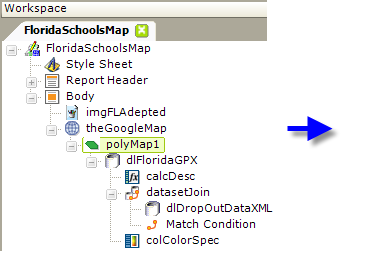
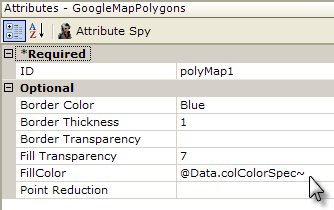
- Reselect the Google Map Polygons element ("polyMap1"), as shown above, and set its Fill Color attribute value to the data token for the Color Spectrum Column added in the previous step.
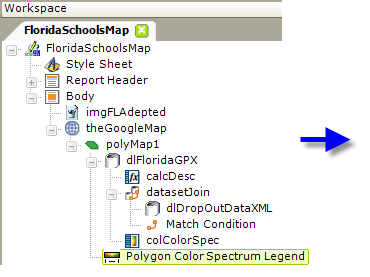
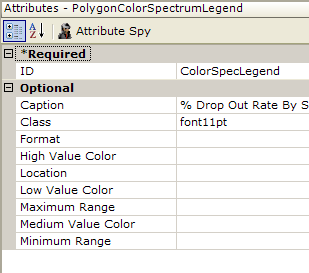
- Finally, beneath the Google Map Polygons element, add a Polygon Color Spectrum Legend element, as shown above. This will create a color gradient legend beneath the map.
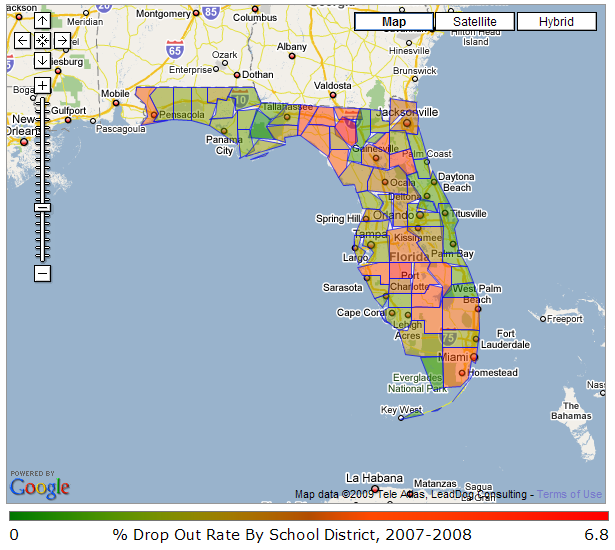
The resulting map looks like the example shown above. The map behaves like any Google Map and can be zoomed and re-centered. This topic continues on page two, with an example showing how to add drill-down capabilities to the polygons.
Add Drill-down Capabilities
One of the most attractive features of Google Maps is their drill-down capabilities: clicking a Map Marker in a map causes a popup info panel to open, which can contain detail information. The same is true for Google Map Polygons - they can also be clicked in order to drill into the data. Continuing with our previous example, here's how this capability is added:
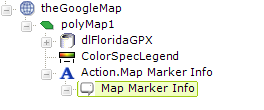
- In the report definition, start by selecting the Google Map Polygons element. Beneath it add an Action.Map Marker Info element, and then beneath it, a Map Marker Info element, as shown above. Neither needs any configuration beyond being given an ID.
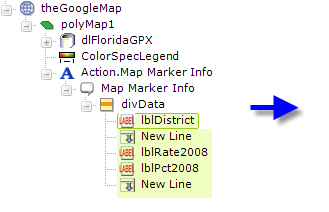
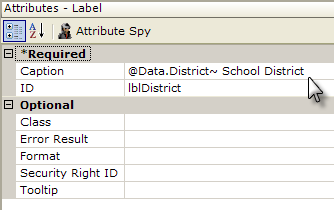
- Beneath the Map Marker Info element, add a Division element and beneath it add several Label and New Line elements, as shown above. The Division allows a uniform style to be applied to the Labels, and the Labels display detail data from the datalayer, which is still in scope. Note the use of an @Data token to display the school district name.
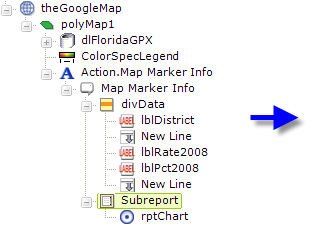
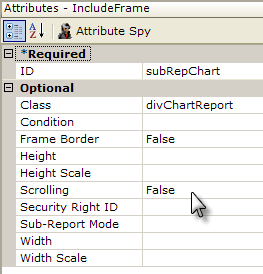
- Next select the Map Marker Info element again and beneath it add SubReport and Target.Report elements, as shown above. This will allow you to add a chart or table, defined in a separate definition, to the popup info panel. Note that the Frame Border and Scrolling attributes are set to False so that the chart or table will embed smoothly into the popup panel.
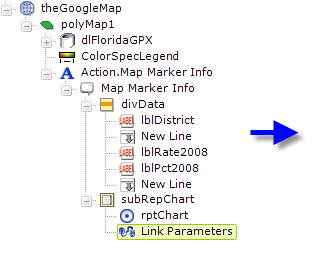
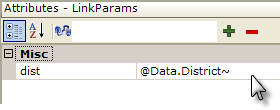
- Finally, a Link Parameters element can be added beneath the SubReport element, as shown above, to pass identifying information to the detail report.
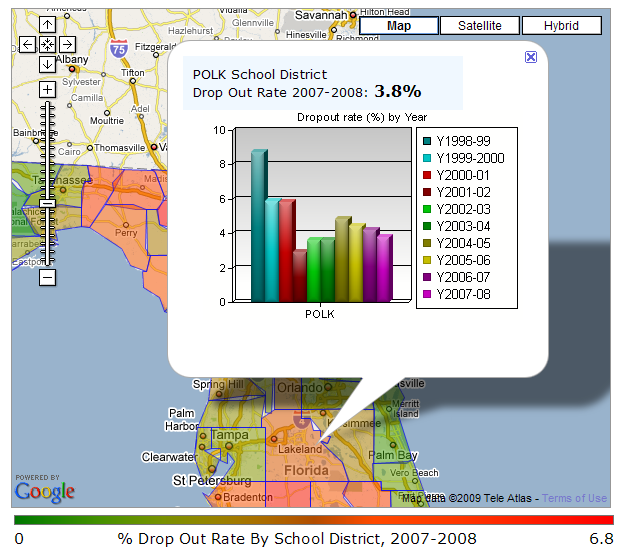
The resulting popup information panel displayed when a polygon is clicked is shown above.
Tools for GIS Data Conversion
As mentioned at the beginning of this topic, GIS data describing geographic region boundaries is used in Logi Info as either a GPX or KML file. In addition, data is also widely available in shapefiles (SHP). Note that these files need to use the standard Mercator projection, based on the WGS 1984 Ellipsoid projection, that Google Maps requires; "conic" projections, for example, will not work.
A search of the Internet will yield many hits for software tools, free and paid, that can convert GIS data into these formats. Logi Analytics does not specifically endorse or recommend any particular tool but we have experimented with the following.
![]() The following resources are provided to you as a courtesy. They're external resources not associated with Logi and we cannot guarantee that the links provided will remain viable. Developers are encouraged to search the Internet for their own resources.
The following resources are provided to you as a courtesy. They're external resources not associated with Logi and we cannot guarantee that the links provided will remain viable. Developers are encouraged to search the Internet for their own resources.
SHP2KML 2.0
The SHP2KML program (freeware) available at http://www.zonums.com/shp2kml.html will convert a SHP file into a google KML file.
GPSBabel
The GPSBabel program (licensed under GNU - but should be fine for just about every use except re-distribution) is available at http://www.gpsbabel.org/ and will convert KML to GPX format.
GPS Visualizer
http://www.gpsvisualizer.com/convert_input?convert_output=gpx
This is a free online conversion tool which is probably good for small files but not larger ones.
ExpertGPS
ExpertGPS makes it very easy to convert SHP files into GPX or KML formats and is available at http://www.expertgps.com/
The program isn't free, but it's relatively low cost ($74.95 for personal use) and is available in a 30-day trial version. The program makes it very easy to convert between SHP and other file formats.
When you download a .zip file containing SHP files, it will contain three files. You'll need to unzip all three files to a folder and then use the "Import" function of the ExpertGPS program to generate the GPX file (you'll only select the .shp file for import but the process reads from the other two files to get the appropriate labels and other metadata). To create the appropriate GPX file for Logi Info to work you need to make sure that you're populating the "Description" field with the boundary name from the SHP file (e.g. zip code, county, etc); it's suggested that you leave all the other fields empty to create the smallest possible GPX file.
Use Data from SQL Server
The Google Map Polygons element can also use DataLayer.SQL to retrieve data from a SQL database for use in plotting geographic areas. The required data format and techniques for loading and retrieving data for this purpose are discussed in this blog post, Logi Analytics Choropleth Maps using SHP Files and SQL Data Layer, by Logi Analystics customer Robert Horvick.
![]() Note that this link is provided as a courtesy and questions regarding the techniques described in this post should be directed to its author, not to Logi Customer Support. Mr. Horvick is not a Logi employee.
Note that this link is provided as a courtesy and questions regarding the techniques described in this post should be directed to its author, not to Logi Customer Support. Mr. Horvick is not a Logi employee.
GIS Data Resources
![]() The following resources are provided to you as a courtesy. They're external resources not associated with Logi and we cannot guarantee that the links provided will remain viable. Developers are encouraged to search the Internet for their own resources.
The following resources are provided to you as a courtesy. They're external resources not associated with Logi and we cannot guarantee that the links provided will remain viable. Developers are encouraged to search the Internet for their own resources.
These web sites provide free, public GIS boundary data in a variety of formats:
United States Census Bureau - These SHP files are perfect for creating the boundaries for any US state or territory.
https://www.census.gov/geographies/mapping-files/time-series/geo/carto-boundary-file.html
Texas State Data Center - Most U.S. states will have information like this available.
https://demographics.texas.gov/Data/Decennial/2010/
UC Berkley - Geographic data for most countries worldwide
http://gif.berkeley.edu/resources/data_subject.html
University of North Carolina - Geographic data for most countries worldwide
https://guides.lib.unc.edu/c.php?g=8661&p=44258
and there many other resources are available on the Internet.