Repeat Elements
The Repeat Elements element allows data-driven replication of elements, making Logi report definitions dynamic and able to automatically accommodate data schema changes. This topic discusses the use of this element.
- About the Repeat Elements element
- Example: Build a Comma-Separated String of Values
- Example: Dynamic Data Table Columns
- Example: Dynamic Tables with Nested Repeat Elements
- Example: Dynamic Analysis Grid Columns
About the Repeat Elements Element
It's not unusual for Logi developers to encounter situations in which there's an uncertainty about the data they're working with. That uncertainty makes it hard to know, during development, how many Logi elements are necessary to present the data in a report definition. This may be due to changing DB schema, or expanding data, or for other reasons.
For example, imagine a scenario in which you're creating a monthly report that displays a table for each project proposal your company receives during the month. However, the number of proposals varies widely each month. How can you define a Data Table for each project if you don't know how many of them there will be (short of editing the definition each month, which is hardly efficient)?
The Repeat Elements element is the right tool for this job! It's associated with a datalayer (the list of projects) and iterates through each row, telling the Logi engine at runtime to create a complete set of its child elements for each row.
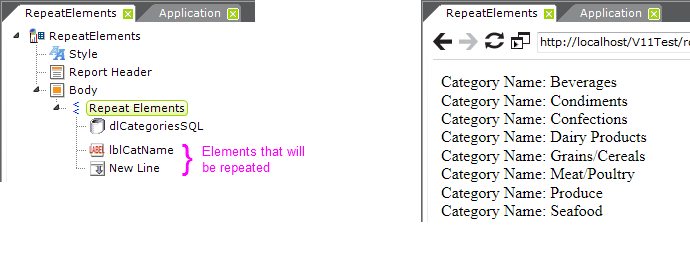
In the definition example above, left, a Repeat Elements element is used. It has its own datalayer and then two other child elements: a Label and a New Line. All of its child elements, not including the datalayer, will be replicated - one set for each datalayer row - by the Logi engine at runtime. The result is shown above, right.
A special token, @Repeat, is used to represent the data. In the example above, the Caption of the Label element ("lblCatName") is:
Category Name: @Repeat.CategoryName~
As usual, the second part of the token is the name of a column in the datalayer.
Yes, you could have just as easily gotten the same result using a regular data table. However, the value of the Repeat Elements element will become more obvious as we go along. The Repeat Elements element can be used anywhere in a report definition, and it can take almost every other element as a child element (except -see below), so you have a lot of flexibility in using it. In the following sections, you'll see examples of a variety of use cases for this element.
Some Token & Element Restrictions
![]() Repeat Elements are one of the very first things processed when a page goes through the Logi Engine and, therefore, some elements and values that are processed later are not available for use with Repeat Elements, including:
Repeat Elements are one of the very first things processed when a page goes through the Logi Engine and, therefore, some elements and values that are processed later are not available for use with Repeat Elements, including:
- @Local tokens
- @Session tokens for variables that have been set in the definition using the Set Session Variables element
- @Request tokens for variables that have been set in the definition using the Default Request Parameters element
- DataLayer.Linked - do not use DataLayer.Linked to provide data to Repeat Elements
- Shared Element - do not include Repeat Elements in a Shared Element; it will not be processed
Example: Build a Comma-Separated String of Values
Have you ever needed to build a comma-separated string of values from data? With the Repeat Elements element, it's easy!
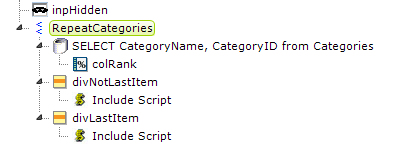
In the definition fragment shown above, a Repeat Elements element is used to iterate through the data and an Input Hidden element is used as the repository of the comma-separated string of values.
The traditional difficulty when building comma-separated strings is avoiding having a trailing comma after the last item in the list. To do this, we need to know when we're processing the last data row. This is where the Rank Column element ("colRank") comes into play. It ranks the datalayer rows, based on the Category ID in this example, in reverse (set its Reverse Rank attribute to True), which means the last data row will have a rank of 1.
Knowing that, we can use two Division elements, with their Condition attributes set to test the ranking, to control the JavaScript that builds the comma-separated string. Here's the Condition attribute for the "divNotLastItem" element above:
@Repeat.colRank~ <> 1
and the other division's Condition tests to see if the rank does equal 1. The two JavaScripts used to create the string either include a trailing comma, or not. Here's the script with the comma:
var myHidden = document.getElementById('inpHidden');
myHidden.value += '@Repeat.CategoryName~,';
and the other one just omits that comma.
After the page is submitted, the completed comma-separated string of values will be available to the next definition as @Request.inpHidden~.
![]() Ranking may not work as a test for the last datalayer row for all scenarios, but there are other ways to do it, including using a Sequence Column and a Aggregate Column (set to COUNT the rows) and comparing the two.
Ranking may not work as a test for the last datalayer row for all scenarios, but there are other ways to do it, including using a Sequence Column and a Aggregate Column (set to COUNT the rows) and comparing the two.
Example: Dynamic Data Table Columns
Suppose you have a requirement to display a data table that may have a varying number of columns. You could use Auto Columns to display the table columns but you want more control over formatting and appearance. This is a perfect opportunity to use Repeat Elements, but assumes that your datasource can accept queries about the data schema. Here's how:

- Start by adding a Data Table element and a datalayer to your definition. Then, as a child of the data table, add a Repeat Elements element, as shown above.

- Next, add a datalayer beneath the Repeat Elements element. This datalayer is going to query the datasource, in this example a SQL server, for information about the table schema. You will need to know the specific syntax required to do this, which can vary widely from one datasource to another. This query is for Microsoft SQL Server 2008:
SELECT column_name,
CASE WHEN data_type = 'nvarchar' THEN 'Text'
WHEN data_type = 'int' THEN 'Number'
WHEN data_type = 'datetime' THEN 'Date'
END As column_type
FROM information_schema.columns
WHERE table_name = 'Orders'
AND ordinal_position < 9 -- limits number of columns returned
ORDER BY ordinal_position
It's pretty straightforward, except for the CASE statement. We're going to add Sort elements to our data table columns later and, to do that, we need to know the data type for each column. The CASE statement translates the data type name in the system schema table to one of the values used in the Sort element's Data Type attribute.

- Now we can add the Data Table Column element, as shown above. Its Column Header attribute makes use of the @Repeat token and the column name we retrieved in the query.
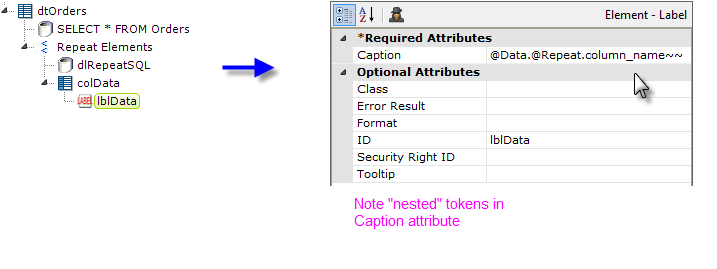
- To display data in the column, we add a Label element. Its Caption uses something you may not have seen before: "nested" tokens. Basically, this is a token within a token; the inner token gets evaluated first, then the outer token. If this was a mathematical expression, it might look like: @Data.(@Repeat.column_name~)~ and the token in the parenthesis gets evaluated first.

- And, finally, we add the Sort element and set its attributes, using @Repeat tokens, as shown above.

When the report is run, we get something like the table shown above. Obviously, additional formatting can be done as well. If the schema of the table changes, the report will handle it without any additional development.
Special Crosstab Table Considerations
If you want to create dynamic Crosstab Tables using Repeat Elements and the techniques shown above, there are some special considerations. When working with Crosstab Tables, you may use Extra Crosstab Value Column elements, summaries, or individual column IDs, all of which use special column names consisting of an "rd" reserved word, a dash, and a column ID, such as "rdCrosstabValue-OrderTotal".
However, these special column names won't work in nested tokens. For example, this nested token won't work:
@Data.rdCrosstabValue-@Repeat.column_name~~
In order to use these special column names correctly in nested tokens, you need to concatenate the "rdCrosstab" reserved word and the dash with the column ID value in the column name data in the Repeat Element element's datalayer. You can do this in your SQL query, or with a Calculated Column element. The @Data.@Repeat.column_name~~ nested token will then work correctly.
Example: Dynamic Tables with Nested Repeat Elements
Let's expand on the previous example - this time we don't even have to know the table names. We can use nested Repeat Elements elements to gather all the information to we need to display the data for whatever tables are available. And, let's do a little more sophisticated formatting, aligning, and also some summarizing.

- This time we'll start by adding a Repeat Elements element to our definition, with a child datalayer, as shown above. Once again, the syntax for querying the schema will vary by datasource and this example is for Microsoft SQL Server 2008. The SQL query, which limits us to three tables for this example, is:
SELECT table_name FROM information_schema.tables
WHERE table_name IN ('Customers', 'Employees', 'Orders')
ORDER BY table_name
Think of this as the "outer loop" of the code, which allows us to iterate through each of the tables.

- Now we'll add a Data Table element, and use @Repeat tokens from the datalayer to give each table its required unique ID and a caption, as shown above.

- Add a datalayer beneath the data table, as shown above, and set its attributes as shown above, right. This query will retrieve that data for each table.

- We want to summarize freight costs for the Orders table, so add an Aggregate Column element beneath the datalayer and set its attributes as shown above.

- Now things begin to get interesting: add anotherRepeat Elements element beneath the data table, as shown above, with its own datalayer. This is the "inner loop" of the code, which iterates the table columns. The SQL query for this datalayer is:
SELECT column_name, data_type,
CASE WHEN data_type = 'nvarchar' THEN ''
WHEN data_type = 'nchar' THEN ''
WHEN data_type = 'int' THEN '######'
WHEN data_type = 'datetime' THEN 'Short Date'
WHEN data_type = 'money' THEN 'Currency'
END As column_format,
CASE WHEN data_type = 'nvarchar' THEN 'ThemeAlignLeft'
WHEN data_type = 'nchar' THEN 'ThemeAlignCenter'
WHEN data_type = 'int' THEN 'ThemeAlignRight'
WHEN data_type = 'datetime' THEN 'ThemeAlignCenter'
WHEN data_type = 'money' THEN 'ThemeAlignRight'
END As column_align
FROM information_schema.columns
WHERE table_name = '@Repeat.table_name~'
AND ordinal_position < 9 -- limits number of columns returned
ORDER BY ordinal_position
The query uses CASE statements to set formatting and alignment values based on the data type the column and, in the WHERE clause, uses an @Repeat token from the first Repeat Elements element (the "outer loop") to limit the result set to a specific table.

- At last we can add a Data Table Column element, as shown above, and set its attributes using @Repeat tokens.

- And then we can add a Label element to display the data, using nested tokens as before, in its attributes as shown. We'll also use an @Repeat token to set the format.
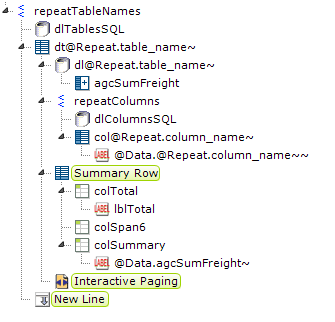
- Finally, we can finish up by adding Summary Row (and its child elements), Interactive Paging, and New Line elements, as shown above. To ensure that the summary row only appears for the Orders table, set the Condition attribute of its three Column child elements to "@Repeat.table_name~" = "Orders".
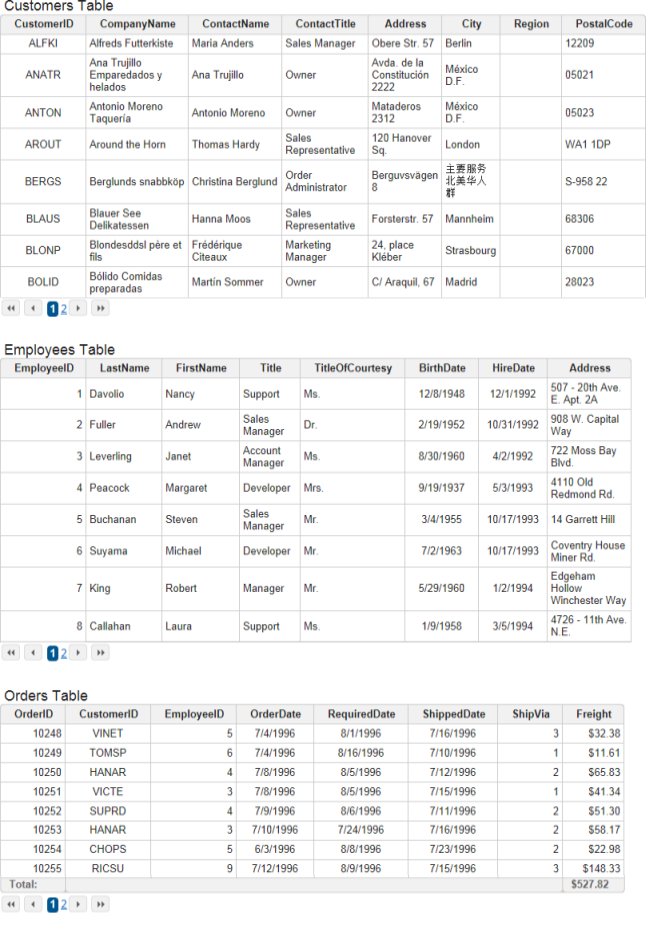
When the report is run, three tables should be displayed, as shown above.
Example: Dynamic Analysis Grid Columns
Repeat Elements can also be used with super-elements, such as the Analysis Grid. This allows you to present dynamic Analysis Grids and let the user select the datasource at run time.
![]()
- We'll start by adding an Analysis Grid element, and its child datalayer, to the definition, as shown above. The datalayer query will retrieve all of the data from the table: SELECT * FROM Orders

- Next, we add Repeat Elements element as a child of the Analysis Grid, with its own child datalayer, as shown above. This datalayer will retrieve the column information from the datasource. Once again, the syntax for querying the schema will vary by datasource and this example is for Microsoft SQL Server 2008. The SQL query is:
SELECT column_name,
CASE WHEN data_type = 'nvarchar' THEN 'Text'
WHEN data_type = 'int' THEN 'Number'
WHEN data_type = 'datetime' THEN 'Date'
END As column_type
FROM information_schema.columns
WHERE table_name = 'Orders'
AND ordinal_position < 9 -- limits number of columns returned
ORDER BY ordinal_position
It's pretty straightforward, except for the CASE statement. We need to specify the column data types for the Analysis Grid columns and, to do that, we need to know the data type for each column. The CASE statement translates the data type name in the system schema table to one of the values used in the Analysis Grid Column element's Data Type attribute.

- Finally, we add an Analysis Grid Column element, as shown above, and set is attributes using @Repeat tokens.

When the report is run, an Analysis Grid will be displayed that dynamically includes the available data columns. Data can be formatted and aligned using techniques from the previous example.