Export to Native Excel
Exporting reports into Microsoft Excel worksheets is a popular and useful method of applying additional analysis to data. This topic discusses techniques for doing this from Logi reporting products.
- About Exporting Reports to Excel
- Export a Report Manually
- Export a Report Automatically
- Specify Excel Column Formatting
- Export Multiple Tables
- Hide Elements When Exporting
- Export MoreInfo Rows
- Cascading Style Sheet Support
- Debug Exports
- Export Considerations
About Exporting Reports
Exporting tabular data into a worksheet allows further computations and analysis to be performed. Microsoft's widely-used Excel spreadsheet program is ideal for this practice and Logi Studio provides appropriate elements for exporting data and reports.
Export features include the ability to export multiple data tables in the same operation (to the same or separate worksheets), to apply style sheets to the exported data, to export report headers, images and charts or just raw table data, to maintain proper time and date formats, and to maintain data table internal cell linefeeds.
Developers interested in inserting data into pre-defined worksheet forms should see Create an Excel Template.
![]() Developers should be aware that Excel imposes column and row limits per worksheet (the exact numbers vary based on the version of Excel). Exported data that exceeds these limits will overflow onto the next worksheet.
Developers should be aware that Excel imposes column and row limits per worksheet (the exact numbers vary based on the version of Excel). Exported data that exceeds these limits will overflow onto the next worksheet.
Developers can specify that the export output be in Excel 2003 and earlier (.xls) or Excel 2007 (.xlsx) formats.
"Export" or "Export Native"?
Earlier versions of Logi managed reporting products included an Action.Export Word Or Excel element and it has been retained for compatibility. However, beginning with version 8, a new element named Action.Export Native Excel was introduced and it you should use it for any new work.
What's the difference? The Action.Export Word Or Excel element causes the Logi server to render the report data into HTML with a MIME type of ".xls"; the client browser handles conversion and display. This has proven to produce uneven results in some browsers. The new Action.Export Native Excel element causes the server to produce true .xls or .xlsx files, which are returned to the client for display, producing more consistent and accurate results.
Manual or Automatic Export
Developers can give users the ability to export a report in two ways: manually (the report is made available for download and can be opened using the Excel browser plug-in) or automatically (the report is written, as an Excel .xls file, to the web server) based on an event or schedule. Manual exports are configured within report definitions and automated exports are configured within process definitions.
Export a Report Manually
Here's an example of how to create a report, with a link,
that exports itself manually:
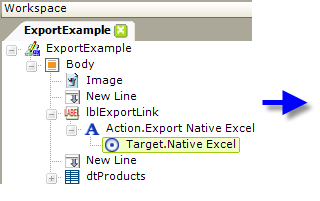
- In your Report definition, add an Action.Export Native Excel element to a Label, Image, Button or Chart element, as shown above.
- Add the required Target.Native Excel element.
- If the report to export is the current report, you need do nothing more. Just save your definition and browse your report. It's that simple.
- If the report to export is not the current report, specify that report by setting the Target.Native Excel element's Report Definition File attribute.
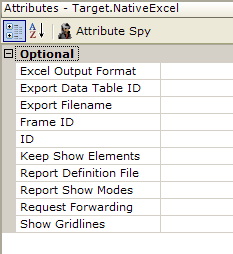
- All Target.Native Excel element attributes are optional. The default settings will export the current report in its entirety.
What Happens: The report is exported to a temporary file which is created in your project folder's rdDownload folder on the web server. The temp file is then returned to the client and opened automatically in the Excel plug-in within your browser (you maybe prompted to Open or Save the Excel file). Temporary files on the server are cleaned up automatically over time.
The following table describes the attributes of the Target.Native Excel element, all of which are optional:
| Attribute | Description |
|---|---|
| Excel Output Format |
Specifies the desired output format of the Excel file created. Set
to Excel2007 to produce an .xlsx file, which supports up to 16K
columns and 1M rows per worksheet. Set to Excel2003 to create an .xls file, with 255 columns and 64K rows per worksheet. Note that .xlsx files can be opened with Office 2003, but
they will lose any data beyond the 255 columns and 64K rows that are
supported. |
| Excel Paper Size | Specifies the default paper size of the Excel workbook, used when it's being printed. Options include A4, Letter, Legal, etc. |
Export Data Table ID | Specifies the ID of a particular data table to be exported, and causes a data only export (no report headers, images, etc. will be output). If left blank, the full report with all data tables, headers, images, etc. will be output. To export the data for an Analysis Grid element, set this value to dtAnalysisGrid. This is the ID of the Analysis Grid's internal Data Table. |
Export File Name | Specifies a custom name for the export files. When left blank, file names consist of a random GUID number and extension. |
Frame ID | Specifies the frame for the target HTML page. Leave blank for the current browser window, or enter NewWindow to open a new browser window. You can also specify an existing frame ID to re-use the same window for each request. |
Keep Show Elements | Specifies whether page items that have been shown or hidden by the user, via Action.ShowElements, remain that way when the report is exported. Set to True so that those elements that were originally hidden but then shown by the user get included in the export. Alternatively, any elements hidden by the user will not be exported. Default: False |
Report Definition File | Specifies the name of a the report definition file to be exported. Default value: the current report |
| Report Show Modes | Specifies the ShowModes strings to be passed to the report when it's rendered for export; makes it possible to hide elements in reports. See the section below Hiding Elements When Exporting. |
| Request Forwarding | Specifies whether to pass all request parameters to the report when it's rendered for export. Default: False |
| Show Gridlines | Specifies gridline behavior in the exported report. In Excel, if two consecutive rows or columns are set to the same style (font, background, foreground color, etc.) the gridlines between them will disappear and this may not provide the desired appearance. Set this attribute to True to show the gridlines in all cases. Default: False |
Export a Report Automatically
The following example, for Logi Info only, shows how to create a process task that exports data automatically:
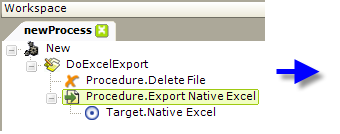
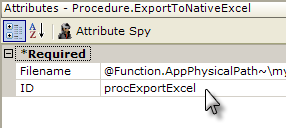
- In your Process definition, add a Procedure.Export Native Excel element to your Task element.
- In the element's Filename attribute, specify the output path and filename, on the web server, for the exported report. The filename should include the ".xls" or ".xlsx" file extension. For example, this value uses a token to export the report to a folder called myExports within your project folder: @Function.AppPhysicalPath~\myExports\myfile.xls
- Ensure that Write permission has been granted for the folder you are exporting to for the local ASPNET (IIS 5.0) or NETWORK SERVICE (IIS 6.0+) account on the web server.
- Note the Procedure.DeleteFile element before the Procedure.Export Native Excel element. The export will not overwrite an existing file so this element is used to delete an older version before the export occurs; no error will occur if there's no existing file to delete. Set its Filename attribute to match that of the Export Native Excel element.
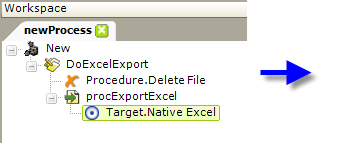
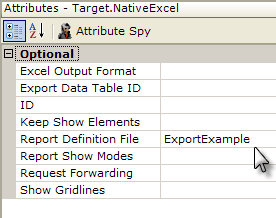
- Add the required Target.Native Excel element.
- In the element's Report Definition File attribute, specify the report to be exported. Note that, in a Process definition, the "CurrentReport" option that appears in the suggested values for this attribute cannot be used. You must specify the actual name of the report.
What Happens: When your task runs, the specified report will be exported to a temporary file in your project folder's rdDownload folder on the web server; the temp file is then copied to your output file.
Specify Excel Column Formatting
Data exported to Excel will generally arrive there as text, and this may not be desirable. So, the formatting of exported data can be controlled on a column-by-column basis using Excel Column Format elements. This element provides developers with the opportunity to separately optimize the appearance of report and exported output and ensure that the exported data is seen as the correct data type.
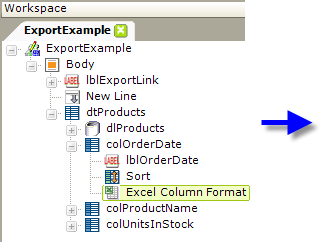
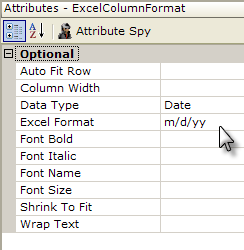
The Excel Column Format element is added as a child of each data column that you want to format, as shown above, and configured to format the data exported to the worksheet.
The following table describes the attributes of the Excel Column Format element:
| Attribute | Description |
|---|---|
Auto Fit Row | When set to True for any column, the height of the Excel rows is automatically adjusted to fit the data. |
Column Width | Specifies the width of the Excel column, in units representing the average character width for the current font. For example, a value of 10 would indicate a column that is usually able to contain 10 characters. The column will always be wide enough to display the value of the Column Header attribute of the Data Table Column element. |
Data Type | Specifies a data type for values in the column; also affects justification of displayed data. |
Excel Format | Applies formatting to the data displayed in Excel. Works with the Data Type attribute, so setting the data type correctly required for correct formatting. |
Font Bold | When set to True, displays the data in Bold or Italic fonts, respectively. |
Font Name | Specifies the name of the font to be used for this data. Font options are presented in a drop-down list. |
Font Size | Specifies the size, in points, of the font used for this data. |
Shrink To Fit | When set to True, automatically reduces the font size of a value that is too long to be displayed in a single cell to a smaller size in order to make it fit. |
Wrap Text | When set to True, causes text that is too long to be displayed in a single cell to be wrapped into additional rows. |
![]() Note that Excel Column Format elements have no effect when used with a table within a SubReport.
Note that Excel Column Format elements have no effect when used with a table within a SubReport.
Export Multiple Tables
If a report contains multiple tables, they can be exported into the same or different worksheets in a single Excel file.
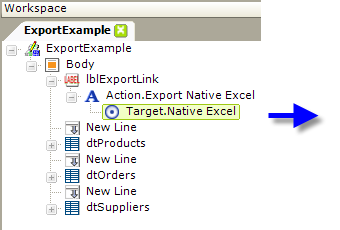
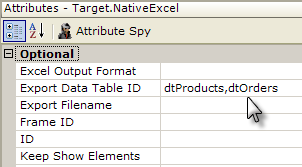
By default, all tables in a report definition will be exported into the same Excel worksheet during an export operation. However, Logi Info developers can instead include tables selectively by entering them as a comma-separated list in the Export Data Table ID attribute of the Target.Native Excel element. The example shown above will only export two of the report's three tables to Excel.
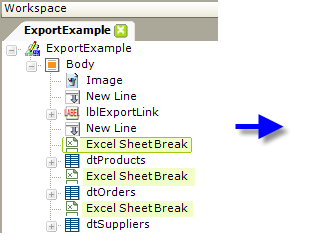
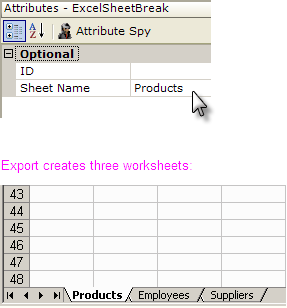
By adding Excel Sheet Break elements in the Body of your report definition, as shown above, you can cause multiple tables to be sent to separate worksheets. The order of the tables in the report definition dictates the order of the worksheets containing them in the export.
The Excel Sheet Break element is only available in Logi Info.
Hide Elements When Exporting
When exporting complete reports to Excel, developers commonly want to hide some of the elements in the report page, like the Export button or link. This can be done very easily using Show Modes.
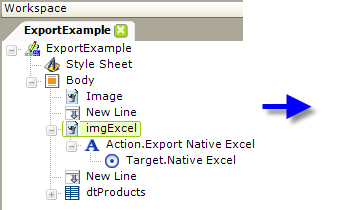
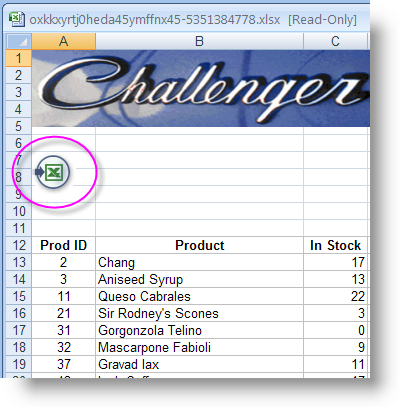
Consider the example shown above. The definition, on the left, includes an image that can be clicked to export the report to Excel. However, when it's exported, shown on the right, the Excel Export icon appears in the worksheet itself. We don't want that icon to appear in the worksheet.
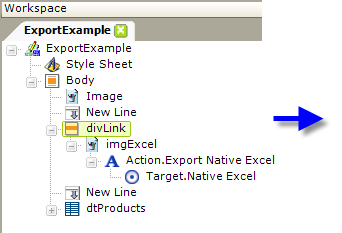
To "hide" the icon in the export, simply place it beneath a Division element. This element supports Show Modes, which the icon, by itself, does not.
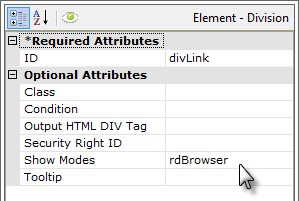
Then set the Division element's Show Modes attribute value to the built-in ShowMode value rdBrowser, as shown above. Elements with this ShowMode value will only be visible in the browser.
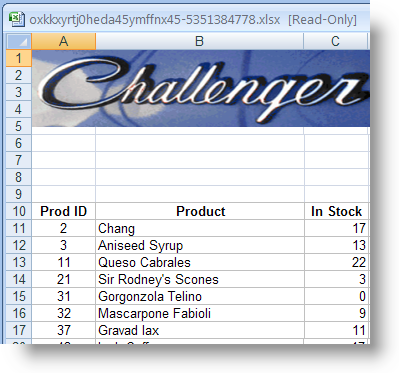
When the report is run and exported, as shown above, the document no longer includes the Export Excel icon.
Export MoreInfo Rows
If your report contains a data table and you're using the More Info Row element to show/hide additional detail data within the table, you may want the detail rows (when visible) to be exported along with the main table data.

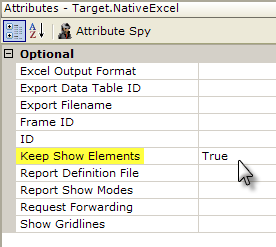
To enable this, as shown above, set your Target.Native Excel element's Keep Show Elements attribute to True.
Keep Show Elements works with Action.Show Elements (used to show/hide the More Info Row) so that items that have been shown or hidden by the user remain that way when the report is re-displayed or exported.Cascading Style Sheet Support
When an Excel export is being generated, the export engine processes any style sheet information along with the report data. Style classes assigned within the report are used; you do not need to do anything additional to specify the style sheet for the export.
If desired, you can use two different style sheets in your report definition, one for the report and one for the Excel export:
- Select the root element of your report definition and set its Default Show Modes attribute value to an arbitrary string, such as "Normal."
- Add two Style Sheet elements to your report definition.
- Assign one Style Sheet element's Show Modes attribute a value that matches the string used in Step 1, "Normal." This style sheet will be used for the regular HTML report.
- Assign the other Style Sheet element's Show Modes attribute a value that matches the Target.Native Excel element's Report Show Modes attribute value (both should be an arbitrary string that does not match the string from Step 1, such as "Export."
Now when the report runs in a browser, the first style sheet will be applied; when it's exported to Excel, the second style sheet will be applied.
What if you want to combine the effects from this section and the previous section, i.e. hide some elements and use different spreadsheets? Just remember that the Show Modes attribute can accept several values, separated by a comma. To combine the examples from these two sections, ensure that the root element's Default Show Modes attribute includes both Show Modes values: "Normal,NoExport" (do not enter the double quotes).
Debug Exports
In v10.0.259 a new feature was added that allows developers to debug their exports. When the debugger has been set to Debugger Links and the report is run, and then exported, a debug link will be included at the bottom of the exported report:
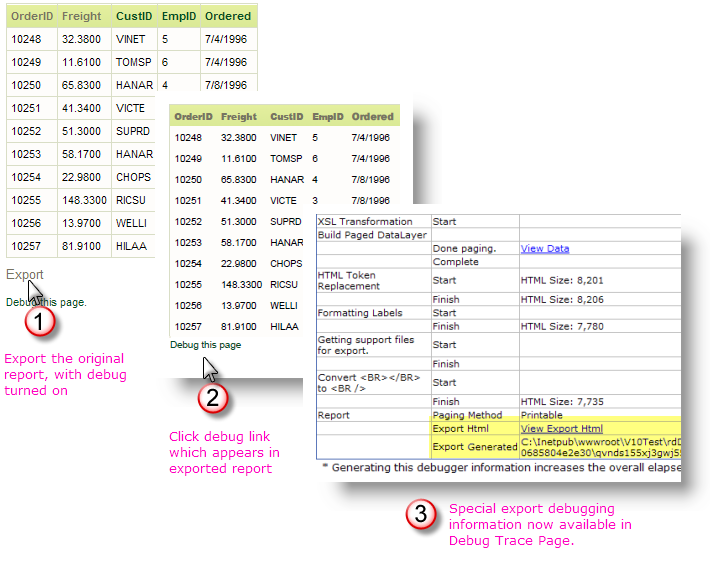
This mechanism allows you to review the export process in more detail and can help to diagnose any problems that may arise.
Export Considerations
The following apply when exporting to Excel:
- Chart color transparency is not available in exports to Excel. Non-animated charts displayed in Logi HTML reports are rendered as .png images and support transparency, however, when exported to Excel, these charts are rendered as .jpg images, which do not support transparency.
- Embedded HTML files in a Logi report may not be exported correctly; success is dependent on the nature of the external HTML file, its adherence to proper XHTML syntax, and other factors.
- Summary Rows, if present in a data table, will be exported to Excel but the summarized data will appear in the worksheet as a text value, not a number.
- Bulleted lists are not supported (using the Bullet element)
- Rectangle element is not supported
- Layout Positioning is not supported
- When a Multi-Column List is exported to Excel, its data is exported into a single Excel column, not multiple columns.