Displaying Null Values in Charts
By default, null values do not appear in charts. If, for example, a user creates a chart showing sales for each day of the week, days for which there were no sales would be omitted from the X axis.
Users looking to include null values in their charts can work around this limitation by using Layout One: Cell-Based Chart. Cell-Based charts allow the user to define each point in a chart.
To ensure that a chart displays null values:
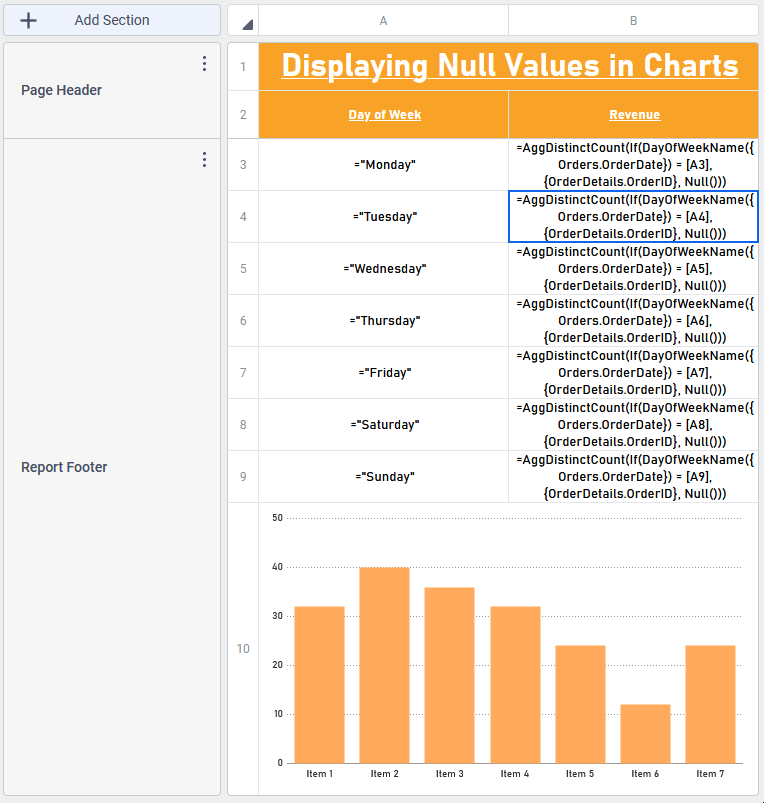
- Set up the report so that each point in the chart has a unique cell corresponding to that point’s X and Y values. Below is how one might do this using the day-of-week sales report example. Each X value (day of the week) has its own cell, and each Y value (number of sales) also has its own cell.


This below utilizes the custom function
DayOfWeekName(). Ask the system administrator about the availability of this function. - Add the chart to the report footer section.
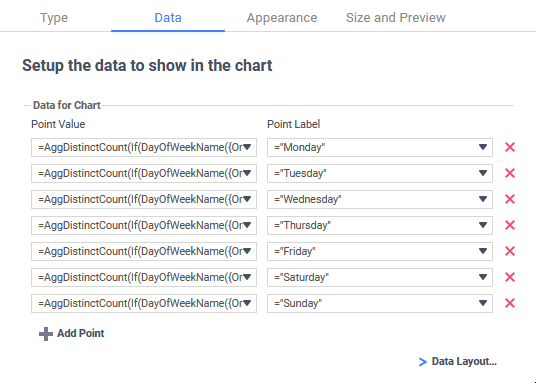
- On the Chart Wizard’s Data tab, advance to the Data tab, and begin assigning each point its X and Y values.

- Click
 Data Layout…, then click Cell Based Chart and finally click Okay.
 - Click Finish to close the Chart Wizard.
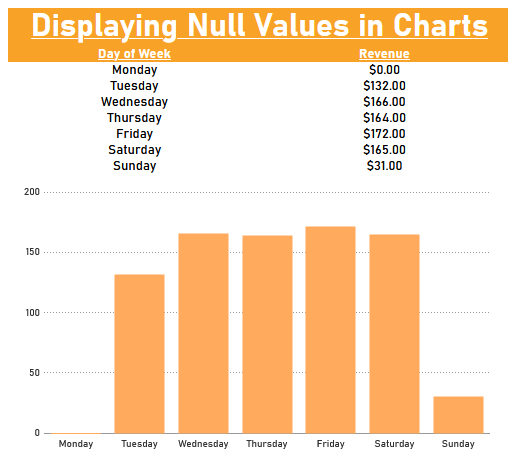
This method will produce output including a point for Monday, even though its Y value is null.
