A Key Performance Indicator or KPI visualization can be used on ExpressViews and Dashboards to show the magnitude of one or several critical values. This value may be a data field, an aggregation of a column or a complex formula.
Examples
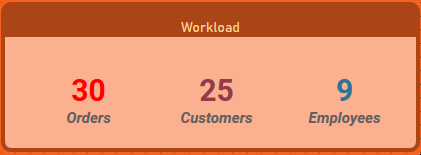
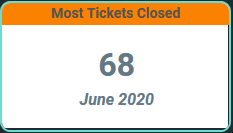
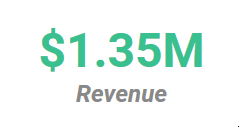
Dashboard Visualization tile with three KPIs displayed showing the workload on the packaging department Dashboard Visualization tile with one KPI displayed showing the number of tickets, and month and year that the service department closed the most number of tickets KPI visualization from an ExpressView in English Short Scale Value Format showing the amount of revenue the company generated