Scatter and Bubble Charts
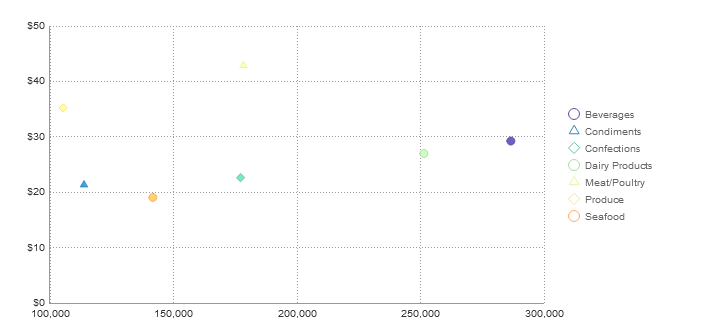
Scatter
Scatter charts use pairs of data values as coordinates for points on a grid. They are often used to find relationships between two variables in a set of data. Scatter charts can be single-series (one set of points) or multi-series (multiple sets of points). On a multi-series chart, series are differentiated by point color and shape.
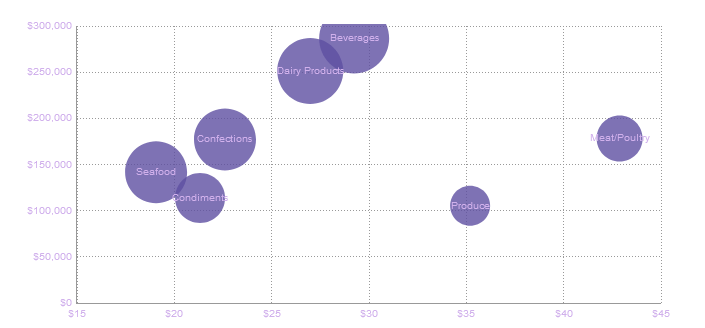
Bubble
Bubble charts are a variation of a Scatter chart. They use pairs of data values as coordinates for “bubbles” on a grid, and a third data value for the size of the bubble. They are often used to find relationships between three variables in a set of data. Bubble charts can be single-series (one set of bubbles) or multi-series (multiple sets of bubbles). On a multi-series chart, series are differentiated by bubble color.