The Chart Grid
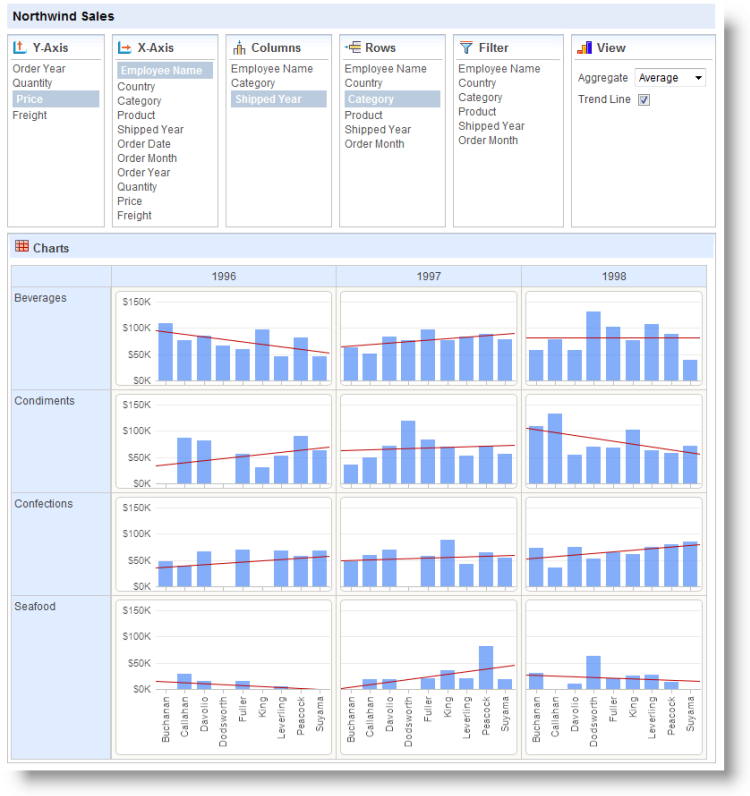
The Chart Grid is a tabular arrangement of charts, wherein each chart fills a table cell. It allows "at-a-glance" comparisons of complex data. As a "super element", the Chart Grid includes a control panel that allows users to customize the table and charts at runtime.
The following topics discuss the use of the Chart Grid:
- Chart Grid Element
- Chart Grid Settings Panels
- Configuring the Data
- Chart Zoom and Drill-through
- Refresh, Reset, and Save Grid Settings
About the Chart Grid
The Chart Grid displays a tabular arrangement of bar, line, or scatter charts, with each table cell containing a separate chart. All of the charts in the grid will be of the same type; it is not possible to mix chart types in different rows or columns.
The Chart Grid is a "super-element", similar to the Analysis Grid and the Dimension Grid elements. At runtime, users can manipulate the data they see and the way in which it's presented using the Chart Grid's user interface controls. The report developer has complete control over which controls are available to a user and can present them selectively to different users.

The example above shows a Chart Grid configured to show all of its option panels.
Each chart resides in the grid at the intersection of a grid row and grid column. The data used to generate any chart is conditioned by filtering the complete dataset so that it only includes data represented by the grid row and grid column intersection. Grid row titles and column headings show the actual data values used for this filtering.
![]() Chart Y-axis labels only appear in the first chart column and the X-axis labels only appear in the bottom row.
The chart type generated is dependent on the X-axis data type selected: text-type columns produce bar charts and numeric- or date-type columns produce line or scatter charts (selectable by user). A technique for using dates with bar charts is explained later in this topic.
Chart Y-axis labels only appear in the first chart column and the X-axis labels only appear in the bottom row.
The chart type generated is dependent on the X-axis data type selected: text-type columns produce bar charts and numeric- or date-type columns produce line or scatter charts (selectable by user). A technique for using dates with bar charts is explained later in this topic.
![]() Chart Canvas charts are used by default by the Chart Grid, in all new applications. Older Logi applications that are upgraded to v12 will use the classic static charts for their Chart Grids. To force upgraded apps to use Chart Canvas charts, add the constant rdFavorChartCanvas
= True
to your _Settings definition.
Chart Canvas charts are used by default by the Chart Grid, in all new applications. Older Logi applications that are upgraded to v12 will use the classic static charts for their Chart Grids. To force upgraded apps to use Chart Canvas charts, add the constant rdFavorChartCanvas
= True
to your _Settings definition.

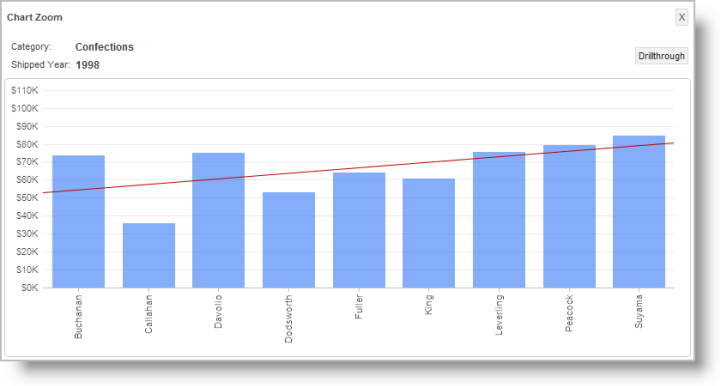
Clicking on an individual chart "zooms" the chart in a popup window, as shown above,

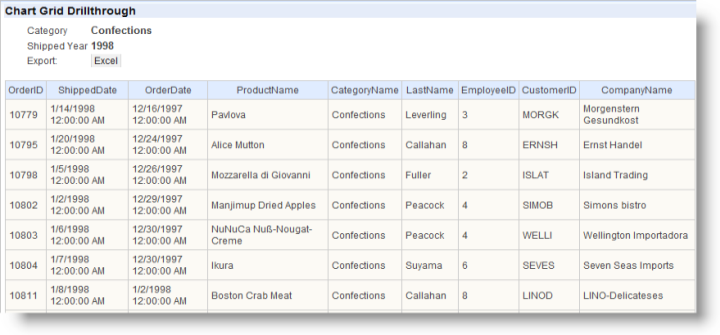
and clicking the zoomed chart's Drillthrough button displays a table, shown above, of the data underlying the chart. The zooming and drill-through functions are automatic and access to them can be controlled by the developer. An export button on the table allows the data to be exported to Excel. The Chart Grid settings selected by a user can be saved at the end of their session and restored during a later session. Logi Studio contains a Chart Grid wizard that will walk developers through creating and configuring the grid. For information about this wizard, see The Chart Grid Wizard.