Series.Funnel
The Chart Canvas element's Series child elements cause a data visualization (the chart) to be rendered in the canvas.
The following topics discuss the Series.Funnel child element:
- Using Multiple Series
- Series.Funnel Attributes
- Adding Data Labels
- Using the Quicktips Element
- Using Action Elements
- Using Input Selection
- Using the Refresh Series Timer
About Series.Funnel
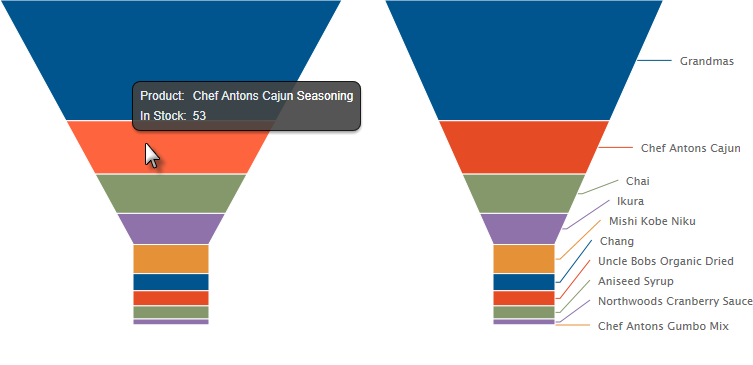
The Series.Funnel element generates a Funnel chart, which displays values as progressively decreasing proportions. The size of each funnel segment is determined as a percentage of the total of all values.

The example above shows Funnel charts, without and with side labels.

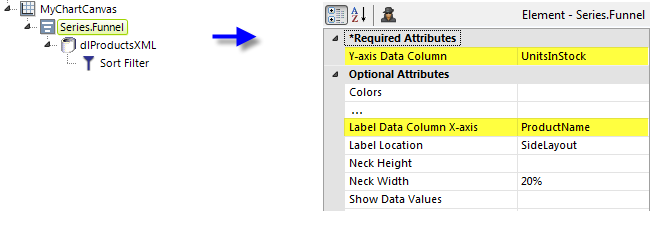
As shown above, the chart is created by adding Series.Funnel to the canvas, along with a datalayer. Very few attributes need to be set for the Series element in order to produce a basic chart.
![]() A datalayer element can be used either beneath Series.Funnel, as shown above, or beneath Chart Canvas. If used as a child of Chart Canvas, its data is available to all child Series elements. This can improve performance if you have several series, all using the same data, beneath the same Chart Canvas element.
A datalayer element can be used either beneath Series.Funnel, as shown above, or beneath Chart Canvas. If used as a child of Chart Canvas, its data is available to all child Series elements. This can improve performance if you have several series, all using the same data, beneath the same Chart Canvas element.

When the Label Location attribute has been set to SideLayout, as in the example, the labels can be styled using the Side Label Style element, as shown above.