Manual Chart Quick Start
Chart Canvas charts are incredibly easy to use! All you need to do to create a chart manually is to add two chart elements, set two attributes, and include a datalayer.
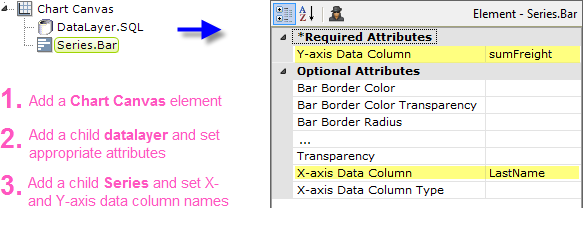
No other chart element attributes need be set - everything else will be done automatically for you.
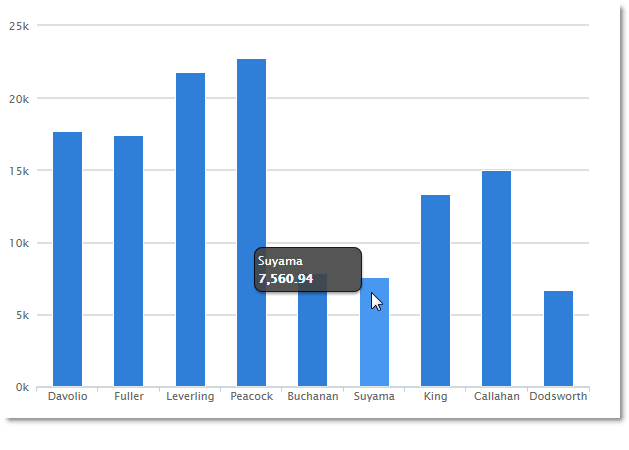
The resulting chart will be automatically-sized and styled, and will include hover-highlighting and quicktips, as shown above. Now let's dig into the elements we used, and others in the Chart Canvas family.