Paginate Data and Print Reports
The volume of data retrieved into Logi reports often requires that tables be presented as a series of pages; in addition, developers often need to offer the ability to print hard copy versions of reports with suitable headers.
The following topics introduce developers to techniques for satisfying both of these requirements:
- Interactive Paging Element Attributes
- Pagination Usage Examples
- Page Navigation using URL
- Creating Printable Reports
About Pagination
Large Data Tables, with hundreds of rows of data, are cumbersome to interact with in a browser-based environment. The concept of navigating through a lot of data using "pages", each with a small number of rows, is familiar to anyone who's used an Internet search engine and looked through the search results. Logi reporting tools include the Interactive Paging element which provides this functionality for Data Tables in Logi applications.
 We do not recommend using Interactive Paging with tables that contain user input elements in each row.
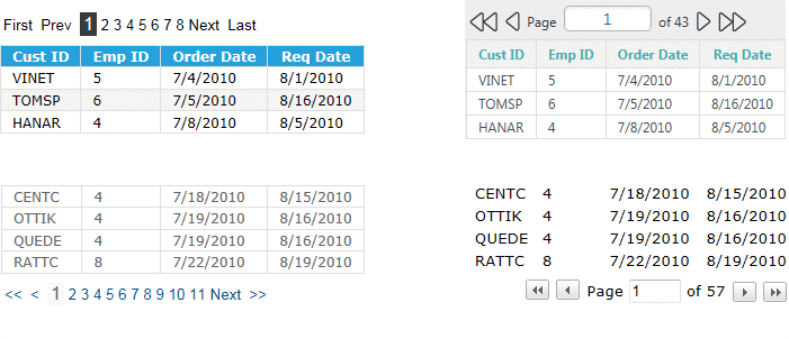
The examples below show four different styles and locations for page navigation links, all of which are created using the Interactive Paging element. The left two examples use Text-type links and the right two use Image-type links:
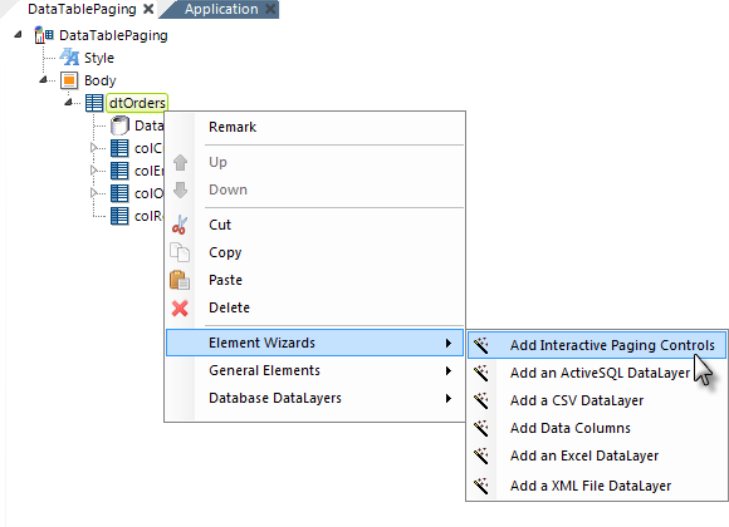
Studio includes a wizard that will add an Interactive Paging element to a report definition and configure it, using the Image-type links shown in the upper-right hand corner of the previous examples.
To use it, select the desired Data Table element, right-click it and select Element Wizards. Then, select Add Interactive Paging Controls, as shown below:
The Interactive Paging element can, of course, be added and configured manually as well.
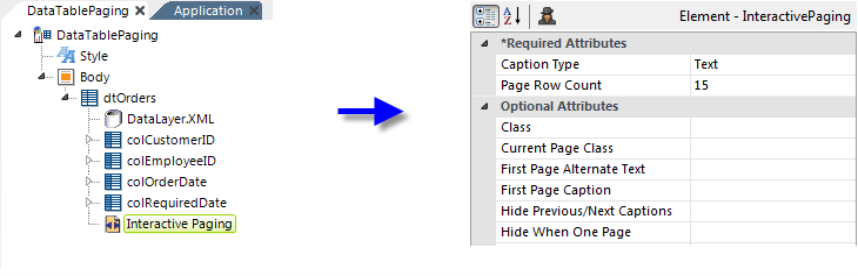
The resulting element is inserted beneath the selected Data Table, as shown above, with its attributes configured by the wizard. For more information, see Paginate Data and Print Reports.